Immigrants from Panama vs Scotch-Irish Single Father Households
COMPARE
Immigrants from Panama
Scotch-Irish
Single Father Households
Single Father Households Comparison
Immigrants from Panama
Scotch-Irish
2.4%
SINGLE FATHER HOUSEHOLDS
41.8/ 100
METRIC RATING
183rd/ 347
METRIC RANK
2.3%
SINGLE FATHER HOUSEHOLDS
69.4/ 100
METRIC RATING
165th/ 347
METRIC RANK
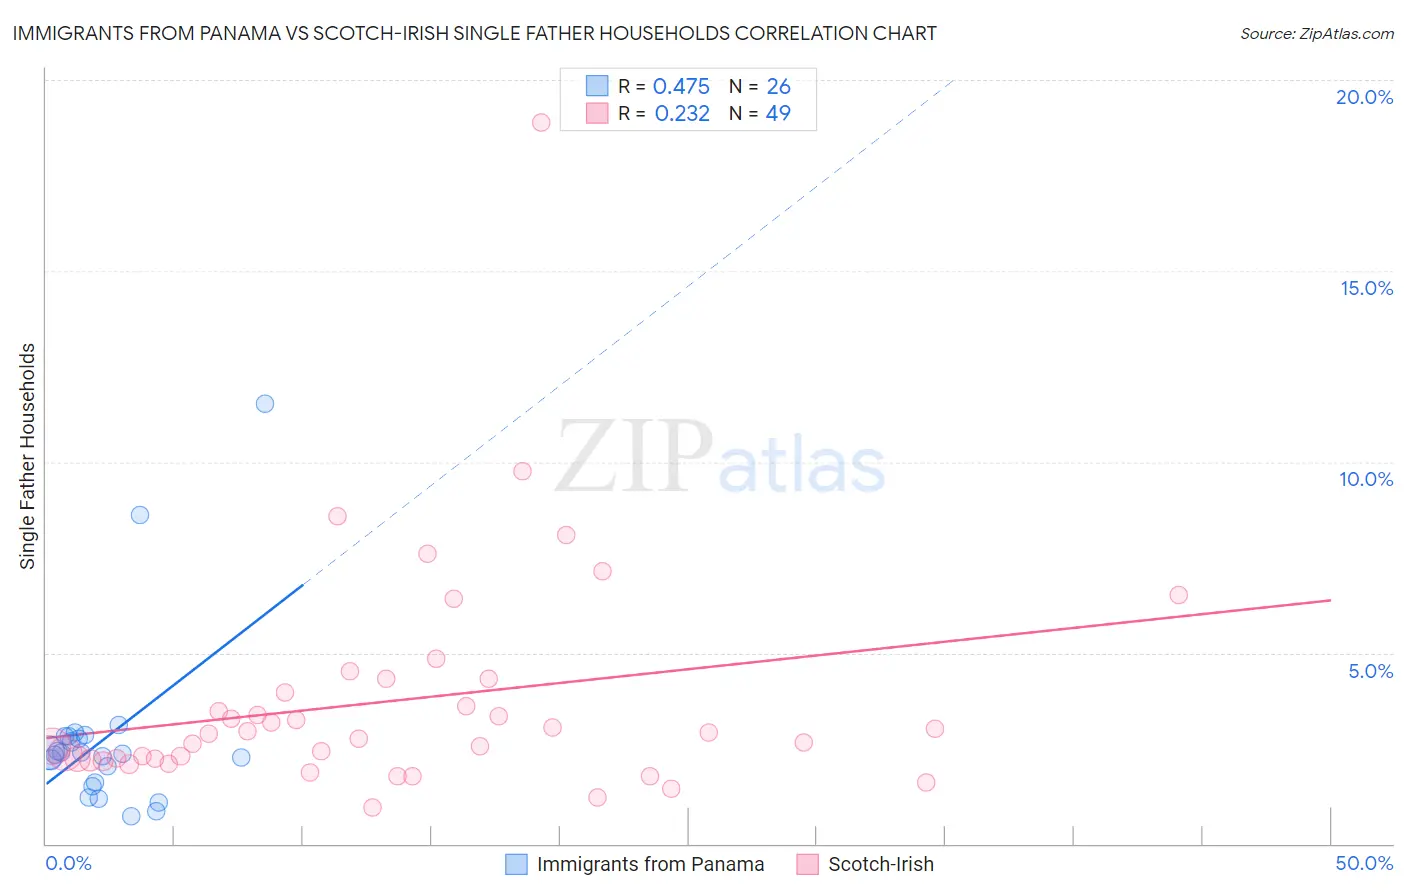
Immigrants from Panama vs Scotch-Irish Single Father Households Correlation Chart
The statistical analysis conducted on geographies consisting of 220,623,122 people shows a moderate positive correlation between the proportion of Immigrants from Panama and percentage of single father households in the United States with a correlation coefficient (R) of 0.475 and weighted average of 2.4%. Similarly, the statistical analysis conducted on geographies consisting of 535,957,408 people shows a weak positive correlation between the proportion of Scotch-Irish and percentage of single father households in the United States with a correlation coefficient (R) of 0.232 and weighted average of 2.3%, a difference of 2.1%.
Single Father Households Correlation Summary
| Measurement | Immigrants from Panama | Scotch-Irish |
| Minimum | 0.72% | 0.96% |
| Maximum | 11.5% | 18.9% |
| Range | 10.8% | 17.9% |
| Mean | 2.7% | 3.7% |
| Median | 2.4% | 2.9% |
| Interquartile 25% (IQ1) | 1.6% | 2.2% |
| Interquartile 75% (IQ3) | 2.8% | 4.1% |
| Interquartile Range (IQR) | 1.2% | 1.9% |
| Standard Deviation (Sample) | 2.3% | 3.0% |
| Standard Deviation (Population) | 2.3% | 3.0% |
Demographics Similar to Immigrants from Panama and Scotch-Irish by Single Father Households
In terms of single father households, the demographic groups most similar to Immigrants from Panama are Sri Lankan (2.4%, a difference of 0.0%), Belgian (2.3%, a difference of 0.11%), Jamaican (2.3%, a difference of 0.12%), Yugoslavian (2.3%, a difference of 0.15%), and Welsh (2.3%, a difference of 0.16%). Similarly, the demographic groups most similar to Scotch-Irish are English (2.3%, a difference of 0.070%), Pakistani (2.3%, a difference of 0.10%), South American (2.3%, a difference of 0.43%), Icelander (2.3%, a difference of 0.53%), and Czech (2.3%, a difference of 0.57%).
| Demographics | Rating | Rank | Single Father Households |
| Pakistanis | 70.6 /100 | #164 | Good 2.3% |
| Scotch-Irish | 69.4 /100 | #165 | Good 2.3% |
| English | 68.6 /100 | #166 | Good 2.3% |
| South Americans | 64.3 /100 | #167 | Good 2.3% |
| Icelanders | 63.1 /100 | #168 | Good 2.3% |
| Czechs | 62.5 /100 | #169 | Good 2.3% |
| Ugandans | 62.2 /100 | #170 | Good 2.3% |
| Swedes | 61.6 /100 | #171 | Good 2.3% |
| Czechoslovakians | 58.9 /100 | #172 | Average 2.3% |
| Celtics | 55.4 /100 | #173 | Average 2.3% |
| Afghans | 50.0 /100 | #174 | Average 2.3% |
| Immigrants | Jamaica | 49.1 /100 | #175 | Average 2.3% |
| Danes | 48.2 /100 | #176 | Average 2.3% |
| Colombians | 48.0 /100 | #177 | Average 2.3% |
| Costa Ricans | 44.1 /100 | #178 | Average 2.3% |
| Welsh | 44.0 /100 | #179 | Average 2.3% |
| Yugoslavians | 43.9 /100 | #180 | Average 2.3% |
| Jamaicans | 43.5 /100 | #181 | Average 2.3% |
| Belgians | 43.3 /100 | #182 | Average 2.3% |
| Immigrants | Panama | 41.8 /100 | #183 | Average 2.4% |
| Sri Lankans | 41.8 /100 | #184 | Average 2.4% |