Immigrants from Thailand vs Cuban Single Father Households
COMPARE
Immigrants from Thailand
Cuban
Single Father Households
Single Father Households Comparison
Immigrants from Thailand
Cubans
2.5%
SINGLE FATHER HOUSEHOLDS
1.8/ 100
METRIC RATING
254th/ 347
METRIC RANK
2.6%
SINGLE FATHER HOUSEHOLDS
0.3/ 100
METRIC RATING
269th/ 347
METRIC RANK
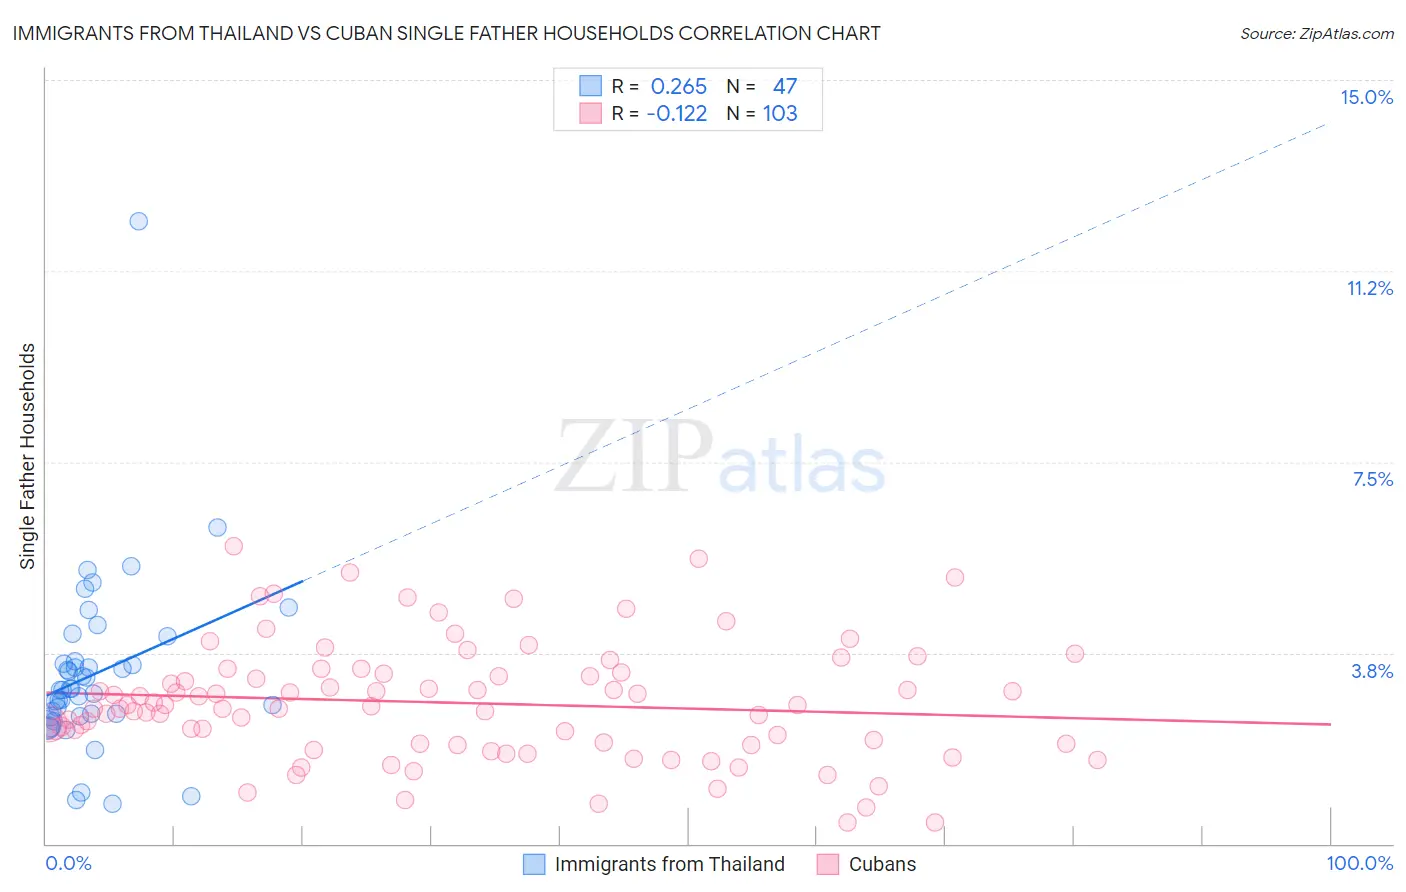
Immigrants from Thailand vs Cuban Single Father Households Correlation Chart
The statistical analysis conducted on geographies consisting of 315,341,972 people shows a weak positive correlation between the proportion of Immigrants from Thailand and percentage of single father households in the United States with a correlation coefficient (R) of 0.265 and weighted average of 2.5%. Similarly, the statistical analysis conducted on geographies consisting of 444,378,615 people shows a poor negative correlation between the proportion of Cubans and percentage of single father households in the United States with a correlation coefficient (R) of -0.122 and weighted average of 2.6%, a difference of 3.2%.
Single Father Households Correlation Summary
| Measurement | Immigrants from Thailand | Cuban |
| Minimum | 0.78% | 0.41% |
| Maximum | 12.2% | 5.8% |
| Range | 11.5% | 5.4% |
| Mean | 3.3% | 2.8% |
| Median | 3.0% | 2.7% |
| Interquartile 25% (IQ1) | 2.5% | 2.0% |
| Interquartile 75% (IQ3) | 3.6% | 3.4% |
| Interquartile Range (IQR) | 1.1% | 1.4% |
| Standard Deviation (Sample) | 1.8% | 1.1% |
| Standard Deviation (Population) | 1.8% | 1.1% |
Demographics Similar to Immigrants from Thailand and Cubans by Single Father Households
In terms of single father households, the demographic groups most similar to Immigrants from Thailand are Immigrants from Somalia (2.5%, a difference of 0.040%), Immigrants from Eritrea (2.5%, a difference of 0.10%), Liberian (2.5%, a difference of 0.13%), Tongan (2.5%, a difference of 0.41%), and Potawatomi (2.5%, a difference of 0.47%). Similarly, the demographic groups most similar to Cubans are Seminole (2.6%, a difference of 0.14%), Haitian (2.6%, a difference of 0.34%), Guamanian/Chamorro (2.6%, a difference of 0.38%), Creek (2.6%, a difference of 0.50%), and French American Indian (2.6%, a difference of 0.86%).
| Demographics | Rating | Rank | Single Father Households |
| Liberians | 2.0 /100 | #251 | Tragic 2.5% |
| Immigrants | Eritrea | 2.0 /100 | #252 | Tragic 2.5% |
| Immigrants | Somalia | 1.9 /100 | #253 | Tragic 2.5% |
| Immigrants | Thailand | 1.8 /100 | #254 | Tragic 2.5% |
| Tongans | 1.5 /100 | #255 | Tragic 2.5% |
| Potawatomi | 1.4 /100 | #256 | Tragic 2.5% |
| Immigrants | Congo | 1.2 /100 | #257 | Tragic 2.5% |
| Spanish | 1.1 /100 | #258 | Tragic 2.5% |
| Comanche | 1.0 /100 | #259 | Tragic 2.5% |
| Immigrants | Caribbean | 1.0 /100 | #260 | Tragic 2.5% |
| Immigrants | Belize | 0.9 /100 | #261 | Tragic 2.5% |
| Immigrants | Liberia | 0.8 /100 | #262 | Tragic 2.5% |
| Dominicans | 0.8 /100 | #263 | Tragic 2.5% |
| Indonesians | 0.5 /100 | #264 | Tragic 2.6% |
| Immigrants | Micronesia | 0.5 /100 | #265 | Tragic 2.6% |
| French American Indians | 0.5 /100 | #266 | Tragic 2.6% |
| Guamanians/Chamorros | 0.4 /100 | #267 | Tragic 2.6% |
| Haitians | 0.4 /100 | #268 | Tragic 2.6% |
| Cubans | 0.3 /100 | #269 | Tragic 2.6% |
| Seminole | 0.3 /100 | #270 | Tragic 2.6% |
| Creek | 0.2 /100 | #271 | Tragic 2.6% |