Alaskan Athabascan vs Basque Divorced or Separated

COMPARE

Alaskan Athabascan
Race
Ancestry
AfghanAfricanAlaska NativeAlaskan AthabascanAlbanianAleutAlsatianAmericanApacheArabArapahoArgentineanArmenianAssyrian/Chaldean/SyriacAustralianAustrianBahamianBangladeshiBarbadianBelgianBelizeanBermudanBhutaneseBlackfeetBolivianBrazilianBritishBritish West IndianBulgarianBurmeseCajunCambodianCanadianCape VerdeanCarpatho RusynCelticCentral AmericanCentral American IndianCherokeeCheyenneChickasawChileanChineseChippewaChoctawColombianColvilleComancheCosta RicanCreeCreekCroatianCrowCubanCypriotCzechCzechoslovakianDanishDelawareDominicanDutchDutch West IndianEastern EuropeanEcuadorianEgyptianEnglishEstonianEthiopianEuropeanFijianFilipinoFinnishFrenchFrench American IndianFrench CanadianGermanGerman RussianGhanaianGreekGuamanian/ChamorroGuatemalanGuyaneseHaitianHmongHonduranHopiHoumaHungarianIcelanderIndian (Asian)IndonesianInupiatIranianIraqiIrishIroquoisIsraeliItalianJamaicanJapaneseJordanianKenyanKiowaKoreanLaotianLatvianLebaneseLiberianLithuanianLumbeeLuxembourgerMacedonianMalaysianMalteseMarshalleseMenomineeMexicanMexican American IndianMongolianMoroccanNative HawaiianNavajoNepaleseNew ZealanderNicaraguanNigerianNorthern EuropeanNorwegianOkinawanOsageOttawaPaiutePakistaniPalestinianPanamanianParaguayanPennsylvania GermanPeruvianPimaPolishPortuguesePotawatomiPuebloPuerto RicanPuget Sound SalishRomanianRussianSalvadoranSamoanScandinavianScotch-IrishScottishSeminoleSenegaleseSerbianShoshoneSierra LeoneanSiouxSlavicSlovakSloveneSomaliSouth AfricanSouth AmericanSouth American IndianSoviet UnionSpaniardSpanishSpanish AmericanSpanish American IndianSri LankanSubsaharan AfricanSudaneseSwedishSwissSyrianTaiwaneseThaiTlingit-HaidaTohono O'OdhamTonganTrinidadian and TobagonianTsimshianTurkishU.S. Virgin IslanderUgandanUkrainianUruguayanUteVenezuelanVietnameseWelshWest IndianYakamaYaquiYugoslavianYumanYup'ikZimbabwean
Immigration
NonimmigrantsImmigrantsAfghanistanAfricaAlbaniaArgentinaArmeniaAsiaAustraliaAustriaBahamasBangladeshBarbadosBelarusBelgiumBelizeBoliviaBosnia and HerzegovinaBrazilBulgariaBurma/MyanmarCabo VerdeCambodiaCameroonCanadaCaribbeanCentral AmericaChileChinaColombiaCongoCosta RicaCroatiaCubaCzechoslovakiaDenmarkDominicaDominican RepublicEastern AfricaEastern AsiaEastern EuropeEcuadorEgyptEl SalvadorEnglandEritreaEthiopiaEuropeFijiFranceGermanyGhanaGreeceGrenadaGuatemalaGuyanaHaitiHondurasHong KongHungaryIndiaIndonesiaIranIraqIrelandIsraelItalyJamaicaJapanJordanKazakhstanKenyaKoreaKuwaitLaosLatin AmericaLatviaLebanonLiberiaLithuaniaMalaysiaMexicoMicronesiaMiddle AfricaMoldovaMoroccoNepalNetherlandsNicaraguaNigeriaNorth AmericaNorth MacedoniaNorthern AfricaNorthern EuropeNorwayOceaniaPakistanPanamaPeruPhilippinesPolandPortugalRomaniaRussiaSaudi ArabiaScotlandSenegalSerbiaSierra LeoneSingaporeSomaliaSouth AfricaSouth AmericaSouth Central AsiaSouth Eastern AsiaSouthern EuropeSpainSri LankaSt. Vincent and the GrenadinesSudanSwedenSwitzerlandSyriaTaiwanThailandTrinidad and TobagoTurkeyUgandaUkraineUruguayUzbekistanVenezuelaVietnamWest IndiesWestern AfricaWestern AsiaWestern EuropeYemenZaireZimbabweAzores
Basque
Race
Ancestry
AfghanAfricanAlaska NativeAlbanianAleutAlsatianAmericanApacheArabArapahoArgentineanArmenianAssyrian/Chaldean/SyriacAustralianAustrianBahamianBangladeshiBarbadianBasqueBelgianBelizeanBermudanBhutaneseBlackfeetBolivianBrazilianBritishBritish West IndianBulgarianBurmeseCajunCambodianCanadianCape VerdeanCarpatho RusynCelticCentral AmericanCentral American IndianCherokeeCheyenneChickasawChileanChineseChippewaChoctawColombianColvilleComancheCosta RicanCreeCreekCroatianCrowCubanCypriotCzechCzechoslovakianDanishDelawareDominicanDutchDutch West IndianEastern EuropeanEcuadorianEgyptianEnglishEstonianEthiopianEuropeanFijianFilipinoFinnishFrenchFrench American IndianFrench CanadianGermanGerman RussianGhanaianGreekGuamanian/ChamorroGuatemalanGuyaneseHaitianHmongHonduranHopiHoumaHungarianIcelanderIndian (Asian)IndonesianInupiatIranianIraqiIrishIroquoisIsraeliItalianJamaicanJapaneseJordanianKenyanKiowaKoreanLaotianLatvianLebaneseLiberianLithuanianLumbeeLuxembourgerMacedonianMalaysianMalteseMarshalleseMenomineeMexicanMexican American IndianMongolianMoroccanNative HawaiianNavajoNepaleseNew ZealanderNicaraguanNigerianNorthern EuropeanNorwegianOkinawanOsageOttawaPaiutePakistaniPalestinianPanamanianParaguayanPennsylvania GermanPeruvianPimaPolishPortuguesePotawatomiPuebloPuerto RicanPuget Sound SalishRomanianRussianSalvadoranSamoanScandinavianScotch-IrishScottishSeminoleSenegaleseSerbianShoshoneSierra LeoneanSiouxSlavicSlovakSloveneSomaliSouth AfricanSouth AmericanSouth American IndianSoviet UnionSpaniardSpanishSpanish AmericanSpanish American IndianSri LankanSubsaharan AfricanSudaneseSwedishSwissSyrianTaiwaneseThaiTlingit-HaidaTohono O'OdhamTonganTrinidadian and TobagonianTsimshianTurkishU.S. Virgin IslanderUgandanUkrainianUruguayanUteVenezuelanVietnameseWelshWest IndianYakamaYaquiYugoslavianYumanYup'ikZimbabwean
Immigration
NonimmigrantsImmigrantsAfghanistanAfricaAlbaniaArgentinaArmeniaAsiaAustraliaAustriaBahamasBangladeshBarbadosBelarusBelgiumBelizeBoliviaBosnia and HerzegovinaBrazilBulgariaBurma/MyanmarCabo VerdeCambodiaCameroonCanadaCaribbeanCentral AmericaChileChinaColombiaCongoCosta RicaCroatiaCubaCzechoslovakiaDenmarkDominicaDominican RepublicEastern AfricaEastern AsiaEastern EuropeEcuadorEgyptEl SalvadorEnglandEritreaEthiopiaEuropeFijiFranceGermanyGhanaGreeceGrenadaGuatemalaGuyanaHaitiHondurasHong KongHungaryIndiaIndonesiaIranIraqIrelandIsraelItalyJamaicaJapanJordanKazakhstanKenyaKoreaKuwaitLaosLatin AmericaLatviaLebanonLiberiaLithuaniaMalaysiaMexicoMicronesiaMiddle AfricaMoldovaMoroccoNepalNetherlandsNicaraguaNigeriaNorth AmericaNorth MacedoniaNorthern AfricaNorthern EuropeNorwayOceaniaPakistanPanamaPeruPhilippinesPolandPortugalRomaniaRussiaSaudi ArabiaScotlandSenegalSerbiaSierra LeoneSingaporeSomaliaSouth AfricaSouth AmericaSouth Central AsiaSouth Eastern AsiaSouthern EuropeSpainSri LankaSt. Vincent and the GrenadinesSudanSwedenSwitzerlandSyriaTaiwanThailandTrinidad and TobagoTurkeyUgandaUkraineUruguayUzbekistanVenezuelaVietnamWest IndiesWestern AfricaWestern AsiaWestern EuropeYemenZaireZimbabweAzores
Divorced or Separated
Income
Poverty
Unemployment
Labor Participation
Family Structure
Vehicle Availability
Education Level
Disability

Divorced or Separated Comparison

Alaskan Athabascans

Basques

Tragic
Tragic
13.1%
DIVORCED OR SEPARATED
0.0/ 100
METRIC RATING
301st/ 347
METRIC RANK
12.6%
DIVORCED OR SEPARATED
0.5/ 100
METRIC RATING
262nd/ 347
METRIC RANK

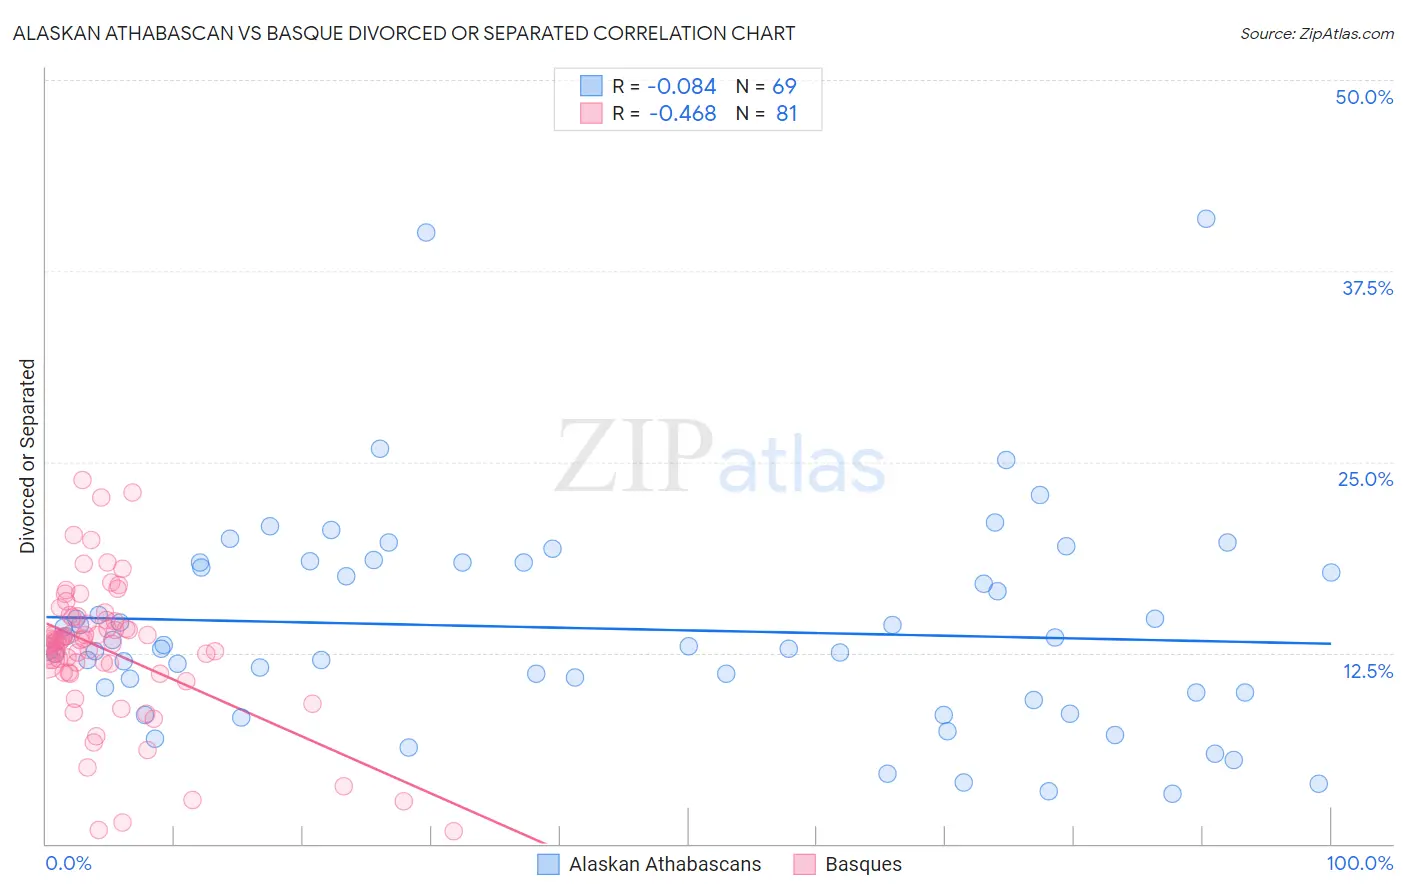
Alaskan Athabascan vs Basque Divorced or Separated Correlation Chart

The statistical analysis conducted on geographies consisting of 45,819,627 people shows a slight negative correlation between the proportion of Alaskan Athabascans and percentage of population currently divorced or separated in the United States with a correlation coefficient (R) of -0.084 and weighted average of 13.1%. Similarly, the statistical analysis conducted on geographies consisting of 165,751,704 people shows a moderate negative correlation between the proportion of Basques and percentage of population currently divorced or separated in the United States with a correlation coefficient (R) of -0.468 and weighted average of 12.6%, a difference of 4.1%.
Alaskan Athabascan vs Basque Divorced or Separated

Divorced or Separated Correlation Summary

MeasurementAlaskan AthabascanBasque
Minimum3.3%0.80%
Maximum40.9%23.8%
Range37.6%23.0%
Mean14.1%12.7%
Median13.0%13.3%
Interquartile 25% (IQ1)9.9%11.2%
Interquartile 75% (IQ3)18.4%14.7%
Interquartile Range (IQR)8.5%3.5%
Standard Deviation (Sample)7.0%4.6%
Standard Deviation (Population)6.9%4.5%

Similar Demographics by Divorced or Separated

Demographics Similar to Alaskan Athabascans by Divorced or Separated

In terms of divorced or separated, the demographic groups most similar to Alaskan Athabascans are Immigrants from Venezuela (13.1%, a difference of 0.10%), Cape Verdean (13.1%, a difference of 0.12%), Immigrants from Cabo Verde (13.1%, a difference of 0.21%), Hopi (13.2%, a difference of 0.25%), and Chippewa (13.2%, a difference of 0.30%).
DemographicsRating | RankDivorced or Separated
Apache
0.0
/100
|
#294
Tragic
12.9%
Celtics
0.0
/100
|
#295
Tragic
13.0%
Nicaraguans
0.0
/100
|
#296
Tragic
13.0%
Natives/Alaskans
0.0
/100
|
#297
Tragic
13.0%
Venezuelans
0.0
/100
|
#298
Tragic
13.0%
Immigrants | Jamaica
0.0
/100
|
#299
Tragic
13.0%
Immigrants | Cabo Verde
0.0
/100
|
#300
Tragic
13.1%
Alaskan Athabascans
0.0
/100
|
#301
Tragic
13.1%
Immigrants | Venezuela
0.0
/100
|
#302
Tragic
13.1%
Cape Verdeans
0.0
/100
|
#303
Tragic
13.1%
Hopi
0.0
/100
|
#304
Tragic
13.2%
Chippewa
0.0
/100
|
#305
Tragic
13.2%
Tlingit-Haida
0.0
/100
|
#306
Tragic
13.2%
French American Indians
0.0
/100
|
#307
Tragic
13.2%
Ottawa
0.0
/100
|
#308
Tragic
13.2%

Demographics Similar to Basques by Divorced or Separated

In terms of divorced or separated, the demographic groups most similar to Basques are Immigrants from Panama (12.6%, a difference of 0.050%), Immigrants from Dominica (12.6%, a difference of 0.060%), English (12.6%, a difference of 0.070%), Yuman (12.6%, a difference of 0.090%), and Immigrants from Uruguay (12.6%, a difference of 0.090%).
DemographicsRating | RankDivorced or Separated
Welsh
0.7
/100
|
#255
Tragic
12.6%
Immigrants | Colombia
0.6
/100
|
#256
Tragic
12.6%
Immigrants | Somalia
0.6
/100
|
#257
Tragic
12.6%
Indonesians
0.6
/100
|
#258
Tragic
12.6%
Yuman
0.6
/100
|
#259
Tragic
12.6%
Immigrants | Uruguay
0.6
/100
|
#260
Tragic
12.6%
Immigrants | Dominica
0.5
/100
|
#261
Tragic
12.6%
Basques
0.5
/100
|
#262
Tragic
12.6%
Immigrants | Panama
0.5
/100
|
#263
Tragic
12.6%
English
0.5
/100
|
#264
Tragic
12.6%
Immigrants | Senegal
0.5
/100
|
#265
Tragic
12.6%
Whites/Caucasians
0.5
/100
|
#266
Tragic
12.6%
Scottish
0.4
/100
|
#267
Tragic
12.6%
Fijians
0.4
/100
|
#268
Tragic
12.6%
Immigrants | Liberia
0.4
/100
|
#269
Tragic
12.6%