Pima vs Immigrants from Hungary Single Father Households
COMPARE
Pima
Immigrants from Hungary
Single Father Households
Single Father Households Comparison
Pima
Immigrants from Hungary
4.2%
SINGLE FATHER HOUSEHOLDS
0.0/ 100
METRIC RATING
343rd/ 347
METRIC RANK
2.1%
SINGLE FATHER HOUSEHOLDS
99.6/ 100
METRIC RATING
85th/ 347
METRIC RANK
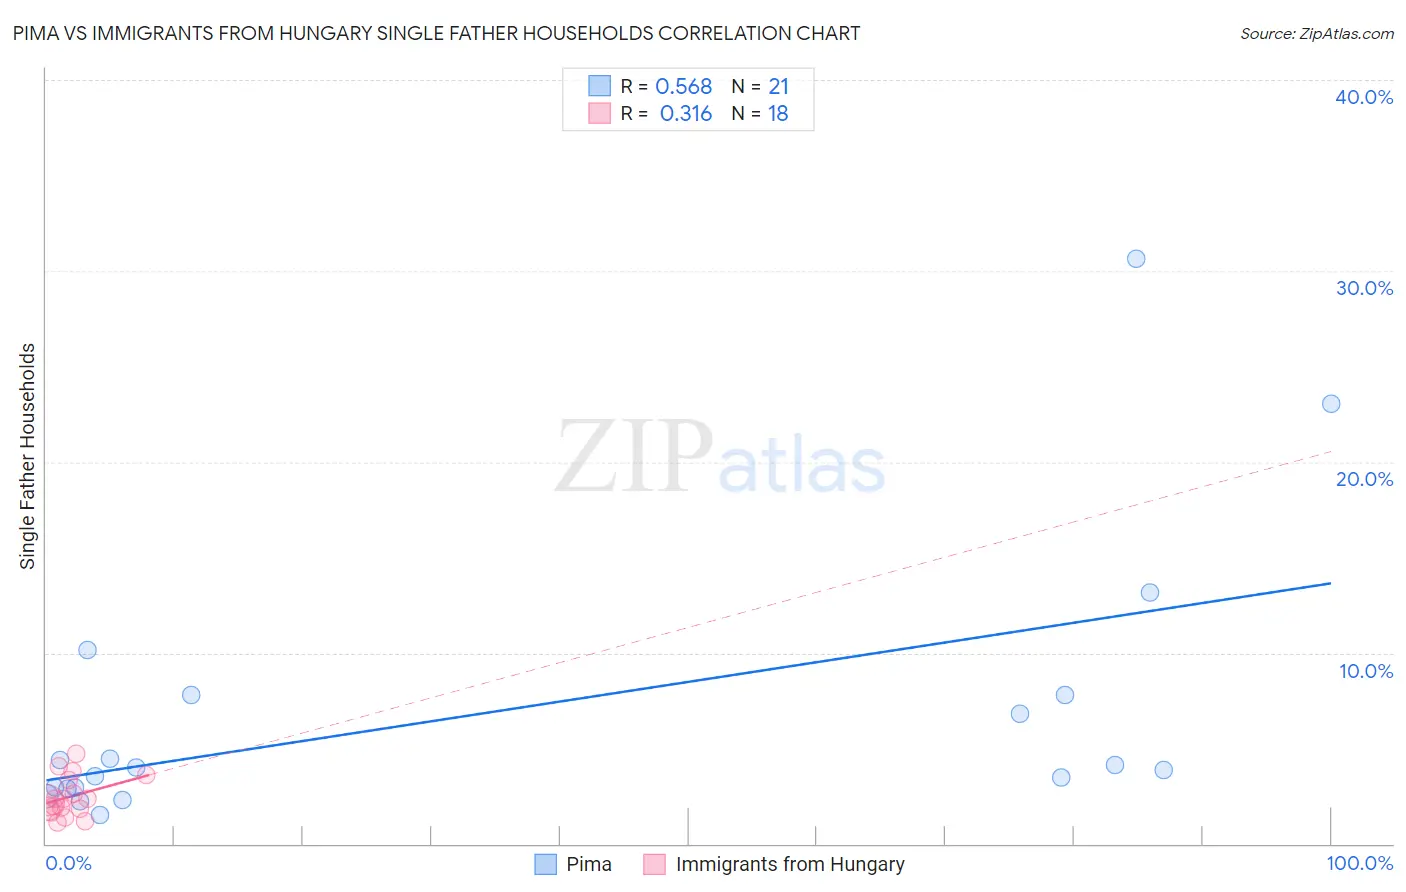
Pima vs Immigrants from Hungary Single Father Households Correlation Chart
The statistical analysis conducted on geographies consisting of 61,336,251 people shows a substantial positive correlation between the proportion of Pima and percentage of single father households in the United States with a correlation coefficient (R) of 0.568 and weighted average of 4.2%. Similarly, the statistical analysis conducted on geographies consisting of 194,547,582 people shows a mild positive correlation between the proportion of Immigrants from Hungary and percentage of single father households in the United States with a correlation coefficient (R) of 0.316 and weighted average of 2.1%, a difference of 99.0%.
Single Father Households Correlation Summary
| Measurement | Pima | Immigrants from Hungary |
| Minimum | 1.5% | 1.1% |
| Maximum | 30.6% | 4.7% |
| Range | 29.1% | 3.6% |
| Mean | 6.9% | 2.5% |
| Median | 4.0% | 2.3% |
| Interquartile 25% (IQ1) | 2.9% | 1.8% |
| Interquartile 75% (IQ3) | 7.8% | 3.3% |
| Interquartile Range (IQR) | 4.9% | 1.5% |
| Standard Deviation (Sample) | 7.3% | 1.0% |
| Standard Deviation (Population) | 7.2% | 1.00% |
Similar Demographics by Single Father Households
Demographics Similar to Pima by Single Father Households
In terms of single father households, the demographic groups most similar to Pima are Yakama (4.2%, a difference of 0.24%), Menominee (4.2%, a difference of 0.93%), Tohono O'odham (3.8%, a difference of 9.2%), Inupiat (4.9%, a difference of 16.4%), and Crow (3.5%, a difference of 18.8%).
| Demographics | Rating | Rank | Single Father Households |
| Natives/Alaskans | 0.0 /100 | #333 | Tragic 3.2% |
| Yuman | 0.0 /100 | #334 | Tragic 3.3% |
| Colville | 0.0 /100 | #335 | Tragic 3.3% |
| Paiute | 0.0 /100 | #336 | Tragic 3.3% |
| Pueblo | 0.0 /100 | #337 | Tragic 3.3% |
| Sioux | 0.0 /100 | #338 | Tragic 3.3% |
| Alaskan Athabascans | 0.0 /100 | #339 | Tragic 3.4% |
| Alaska Natives | 0.0 /100 | #340 | Tragic 3.5% |
| Crow | 0.0 /100 | #341 | Tragic 3.5% |
| Tohono O'odham | 0.0 /100 | #342 | Tragic 3.8% |
| Pima | 0.0 /100 | #343 | Tragic 4.2% |
| Yakama | 0.0 /100 | #344 | Tragic 4.2% |
| Menominee | 0.0 /100 | #345 | Tragic 4.2% |
| Inupiat | 0.0 /100 | #346 | Tragic 4.9% |
| Yup'ik | 0.0 /100 | #347 | Tragic 5.4% |
Demographics Similar to Immigrants from Hungary by Single Father Households
In terms of single father households, the demographic groups most similar to Immigrants from Hungary are Carpatho Rusyn (2.1%, a difference of 0.040%), Asian (2.1%, a difference of 0.080%), Greek (2.1%, a difference of 0.34%), New Zealander (2.1%, a difference of 0.35%), and Armenian (2.1%, a difference of 0.40%).
| Demographics | Rating | Rank | Single Father Households |
| Estonians | 99.7 /100 | #78 | Exceptional 2.1% |
| Immigrants | Asia | 99.7 /100 | #79 | Exceptional 2.1% |
| Immigrants | South Africa | 99.7 /100 | #80 | Exceptional 2.1% |
| Armenians | 99.7 /100 | #81 | Exceptional 2.1% |
| New Zealanders | 99.7 /100 | #82 | Exceptional 2.1% |
| Greeks | 99.7 /100 | #83 | Exceptional 2.1% |
| Carpatho Rusyns | 99.6 /100 | #84 | Exceptional 2.1% |
| Immigrants | Hungary | 99.6 /100 | #85 | Exceptional 2.1% |
| Asians | 99.6 /100 | #86 | Exceptional 2.1% |
| Lithuanians | 99.5 /100 | #87 | Exceptional 2.1% |
| Bhutanese | 99.5 /100 | #88 | Exceptional 2.1% |
| Immigrants | Armenia | 99.5 /100 | #89 | Exceptional 2.1% |
| Immigrants | Pakistan | 99.5 /100 | #90 | Exceptional 2.1% |
| Immigrants | Guyana | 99.4 /100 | #91 | Exceptional 2.1% |
| Romanians | 99.4 /100 | #92 | Exceptional 2.1% |