Scottish vs Immigrants from Hungary Median Male Earnings
COMPARE
Scottish
Immigrants from Hungary
Median Male Earnings
Median Male Earnings Comparison
Scottish
Immigrants from Hungary
$55,793
MEDIAN MALE EARNINGS
78.2/ 100
METRIC RATING
148th/ 347
METRIC RANK
$59,806
MEDIAN MALE EARNINGS
99.5/ 100
METRIC RATING
80th/ 347
METRIC RANK
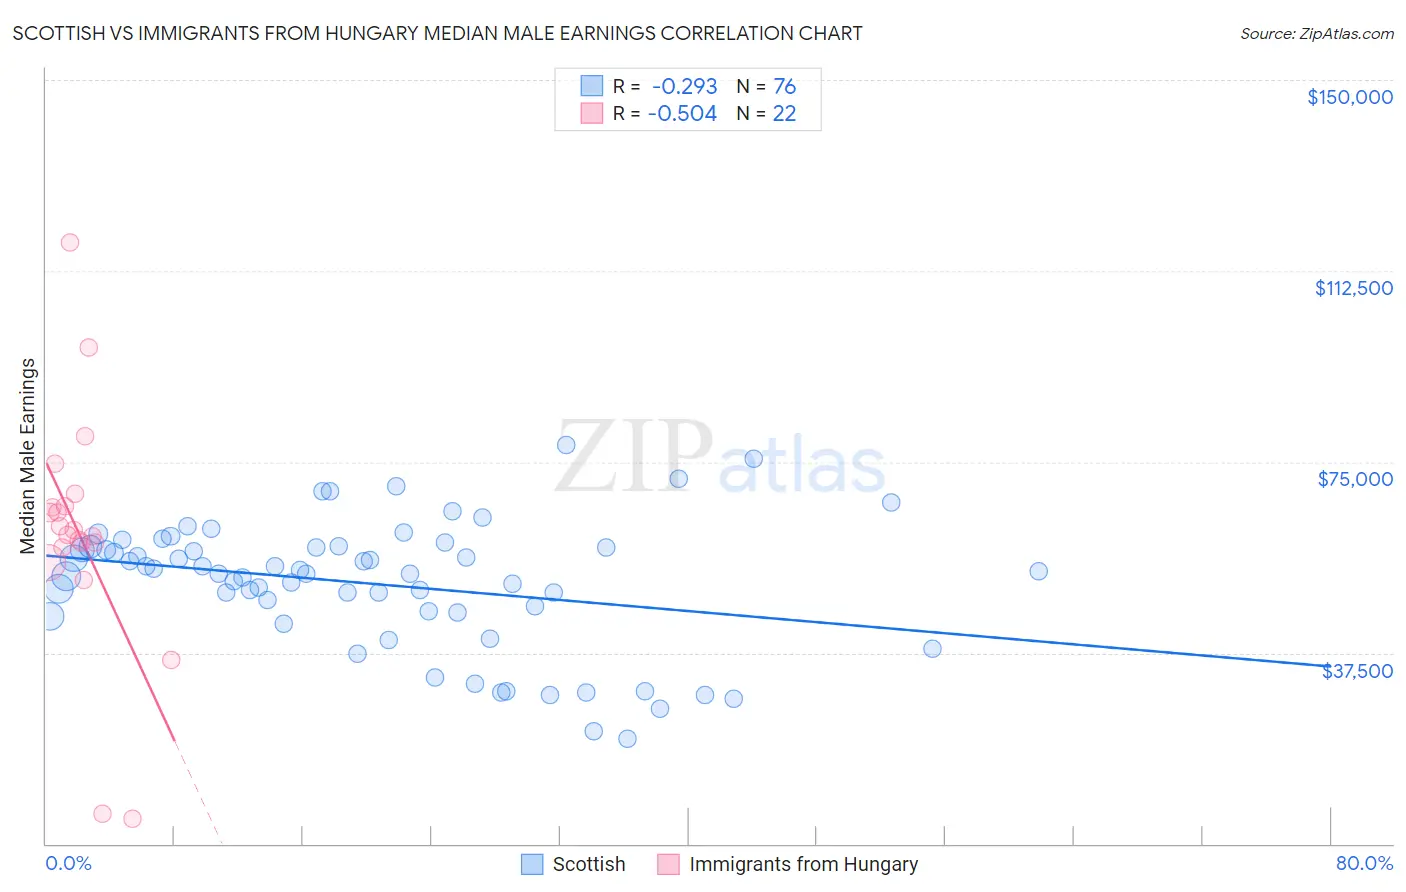
Scottish vs Immigrants from Hungary Median Male Earnings Correlation Chart
The statistical analysis conducted on geographies consisting of 565,821,197 people shows a weak negative correlation between the proportion of Scottish and median male earnings in the United States with a correlation coefficient (R) of -0.293 and weighted average of $55,793. Similarly, the statistical analysis conducted on geographies consisting of 195,676,338 people shows a substantial negative correlation between the proportion of Immigrants from Hungary and median male earnings in the United States with a correlation coefficient (R) of -0.504 and weighted average of $59,806, a difference of 7.2%.
Median Male Earnings Correlation Summary
| Measurement | Scottish | Immigrants from Hungary |
| Minimum | $20,625 | $4,861 |
| Maximum | $78,335 | $118,099 |
| Range | $57,710 | $113,238 |
| Mean | $51,052 | $60,734 |
| Median | $53,253 | $61,103 |
| Interquartile 25% (IQ1) | $45,587 | $58,200 |
| Interquartile 75% (IQ3) | $58,253 | $66,315 |
| Interquartile Range (IQR) | $12,667 | $8,115 |
| Standard Deviation (Sample) | $12,626 | $24,141 |
| Standard Deviation (Population) | $12,543 | $23,586 |
Similar Demographics by Median Male Earnings
Demographics Similar to Scottish by Median Male Earnings
In terms of median male earnings, the demographic groups most similar to Scottish are Immigrants from Philippines ($55,809, a difference of 0.030%), English ($55,747, a difference of 0.080%), Swiss ($55,731, a difference of 0.11%), Immigrants from Oceania ($55,712, a difference of 0.15%), and Peruvian ($55,659, a difference of 0.24%).
| Demographics | Rating | Rank | Median Male Earnings |
| Danes | 84.8 /100 | #141 | Excellent $56,246 |
| Ethiopians | 84.8 /100 | #142 | Excellent $56,243 |
| Sri Lankans | 83.4 /100 | #143 | Excellent $56,136 |
| Immigrants | Uganda | 82.4 /100 | #144 | Excellent $56,064 |
| Norwegians | 80.9 /100 | #145 | Excellent $55,965 |
| Immigrants | Chile | 80.7 /100 | #146 | Excellent $55,954 |
| Immigrants | Philippines | 78.4 /100 | #147 | Good $55,809 |
| Scottish | 78.2 /100 | #148 | Good $55,793 |
| English | 77.4 /100 | #149 | Good $55,747 |
| Swiss | 77.1 /100 | #150 | Good $55,731 |
| Immigrants | Oceania | 76.8 /100 | #151 | Good $55,712 |
| Peruvians | 75.8 /100 | #152 | Good $55,659 |
| Immigrants | Nepal | 75.0 /100 | #153 | Good $55,615 |
| Taiwanese | 73.9 /100 | #154 | Good $55,556 |
| Scandinavians | 73.4 /100 | #155 | Good $55,527 |
Demographics Similar to Immigrants from Hungary by Median Male Earnings
In terms of median male earnings, the demographic groups most similar to Immigrants from Hungary are Immigrants from Ukraine ($59,820, a difference of 0.020%), Ukrainian ($59,728, a difference of 0.13%), Croatian ($59,715, a difference of 0.15%), Immigrants from Italy ($59,691, a difference of 0.19%), and Immigrants from Egypt ($59,925, a difference of 0.20%).
| Demographics | Rating | Rank | Median Male Earnings |
| Immigrants | North America | 99.7 /100 | #73 | Exceptional $60,265 |
| Argentineans | 99.6 /100 | #74 | Exceptional $60,117 |
| Immigrants | Bolivia | 99.6 /100 | #75 | Exceptional $60,088 |
| Romanians | 99.6 /100 | #76 | Exceptional $60,063 |
| Paraguayans | 99.5 /100 | #77 | Exceptional $59,975 |
| Immigrants | Egypt | 99.5 /100 | #78 | Exceptional $59,925 |
| Immigrants | Ukraine | 99.5 /100 | #79 | Exceptional $59,820 |
| Immigrants | Hungary | 99.5 /100 | #80 | Exceptional $59,806 |
| Ukrainians | 99.4 /100 | #81 | Exceptional $59,728 |
| Croatians | 99.4 /100 | #82 | Exceptional $59,715 |
| Immigrants | Italy | 99.4 /100 | #83 | Exceptional $59,691 |
| Afghans | 99.3 /100 | #84 | Exceptional $59,554 |
| Italians | 99.3 /100 | #85 | Exceptional $59,551 |
| Immigrants | England | 99.3 /100 | #86 | Exceptional $59,527 |
| Macedonians | 99.3 /100 | #87 | Exceptional $59,522 |