Scottish vs Belizean Divorced or Separated
COMPARE
Scottish
Belizean
Divorced or Separated
Divorced or Separated Comparison
Scottish
Belizeans
12.6%
DIVORCED OR SEPARATED
0.4/ 100
METRIC RATING
267th/ 347
METRIC RANK
12.1%
DIVORCED OR SEPARATED
37.7/ 100
METRIC RATING
187th/ 347
METRIC RANK
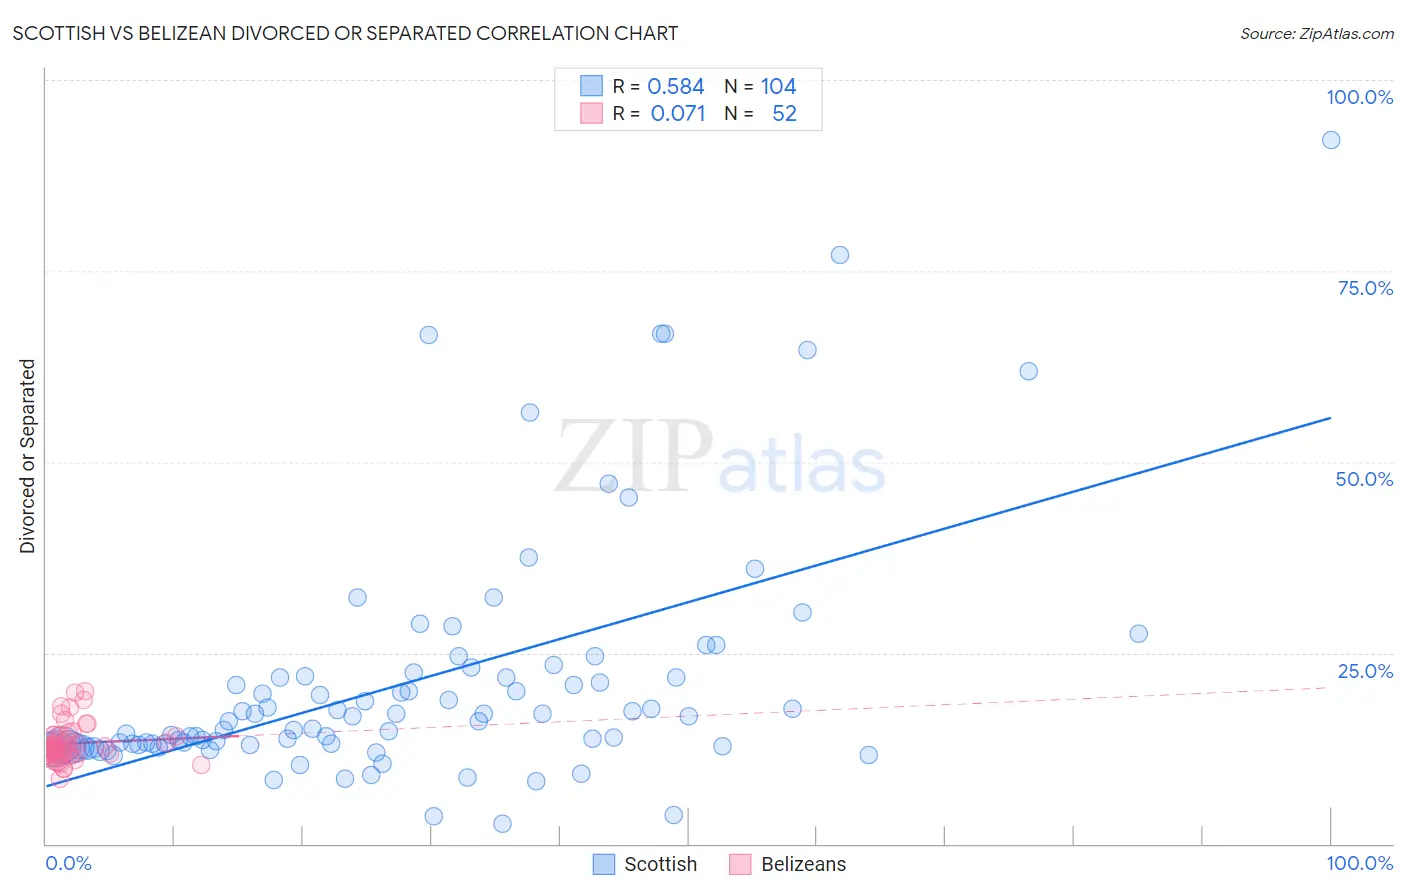
Scottish vs Belizean Divorced or Separated Correlation Chart
The statistical analysis conducted on geographies consisting of 566,665,399 people shows a substantial positive correlation between the proportion of Scottish and percentage of population currently divorced or separated in the United States with a correlation coefficient (R) of 0.584 and weighted average of 12.6%. Similarly, the statistical analysis conducted on geographies consisting of 144,199,730 people shows a slight positive correlation between the proportion of Belizeans and percentage of population currently divorced or separated in the United States with a correlation coefficient (R) of 0.071 and weighted average of 12.1%, a difference of 4.3%.
Divorced or Separated Correlation Summary
| Measurement | Scottish | Belizean |
| Minimum | 2.6% | 8.5% |
| Maximum | 92.2% | 20.0% |
| Range | 89.6% | 11.5% |
| Mean | 21.2% | 13.1% |
| Median | 16.0% | 12.5% |
| Interquartile 25% (IQ1) | 12.8% | 11.8% |
| Interquartile 75% (IQ3) | 21.8% | 14.2% |
| Interquartile Range (IQR) | 9.1% | 2.4% |
| Standard Deviation (Sample) | 16.0% | 2.5% |
| Standard Deviation (Population) | 15.9% | 2.5% |
Similar Demographics by Divorced or Separated
Demographics Similar to Scottish by Divorced or Separated
In terms of divorced or separated, the demographic groups most similar to Scottish are Fijian (12.6%, a difference of 0.010%), Immigrants from Liberia (12.6%, a difference of 0.030%), White/Caucasian (12.6%, a difference of 0.040%), Immigrants from Senegal (12.6%, a difference of 0.050%), and English (12.6%, a difference of 0.070%).
| Demographics | Rating | Rank | Divorced or Separated |
| Immigrants | Uruguay | 0.6 /100 | #260 | Tragic 12.6% |
| Immigrants | Dominica | 0.5 /100 | #261 | Tragic 12.6% |
| Basques | 0.5 /100 | #262 | Tragic 12.6% |
| Immigrants | Panama | 0.5 /100 | #263 | Tragic 12.6% |
| English | 0.5 /100 | #264 | Tragic 12.6% |
| Immigrants | Senegal | 0.5 /100 | #265 | Tragic 12.6% |
| Whites/Caucasians | 0.5 /100 | #266 | Tragic 12.6% |
| Scottish | 0.4 /100 | #267 | Tragic 12.6% |
| Fijians | 0.4 /100 | #268 | Tragic 12.6% |
| Immigrants | Liberia | 0.4 /100 | #269 | Tragic 12.6% |
| Ute | 0.4 /100 | #270 | Tragic 12.6% |
| Panamanians | 0.3 /100 | #271 | Tragic 12.7% |
| Immigrants | Middle Africa | 0.3 /100 | #272 | Tragic 12.7% |
| Immigrants | Micronesia | 0.3 /100 | #273 | Tragic 12.7% |
| Bermudans | 0.3 /100 | #274 | Tragic 12.7% |
Demographics Similar to Belizeans by Divorced or Separated
In terms of divorced or separated, the demographic groups most similar to Belizeans are Immigrants from Belize (12.1%, a difference of 0.0%), Immigrants from Chile (12.1%, a difference of 0.050%), Sierra Leonean (12.1%, a difference of 0.080%), Immigrants from Nigeria (12.1%, a difference of 0.10%), and Moroccan (12.1%, a difference of 0.11%).
| Demographics | Rating | Rank | Divorced or Separated |
| Barbadians | 45.0 /100 | #180 | Average 12.1% |
| Immigrants | Canada | 44.0 /100 | #181 | Average 12.1% |
| Immigrants | Ethiopia | 43.1 /100 | #182 | Average 12.1% |
| Immigrants | Central America | 42.9 /100 | #183 | Average 12.1% |
| Immigrants | North America | 41.1 /100 | #184 | Average 12.1% |
| Immigrants | Nigeria | 40.5 /100 | #185 | Average 12.1% |
| Immigrants | Chile | 39.0 /100 | #186 | Fair 12.1% |
| Belizeans | 37.7 /100 | #187 | Fair 12.1% |
| Immigrants | Belize | 37.6 /100 | #188 | Fair 12.1% |
| Sierra Leoneans | 35.5 /100 | #189 | Fair 12.1% |
| Moroccans | 34.8 /100 | #190 | Fair 12.1% |
| Swedes | 34.4 /100 | #191 | Fair 12.1% |
| Norwegians | 33.2 /100 | #192 | Fair 12.1% |
| Immigrants | Thailand | 32.5 /100 | #193 | Fair 12.1% |
| Immigrants | Eritrea | 31.9 /100 | #194 | Fair 12.1% |