Bangladeshi vs Immigrants from France Divorced or Separated
COMPARE
Bangladeshi
Immigrants from France
Divorced or Separated
Divorced or Separated Comparison
Bangladeshis
Immigrants from France
12.3%
DIVORCED OR SEPARATED
10.5/ 100
METRIC RATING
222nd/ 347
METRIC RANK
11.7%
DIVORCED OR SEPARATED
96.6/ 100
METRIC RATING
112th/ 347
METRIC RANK
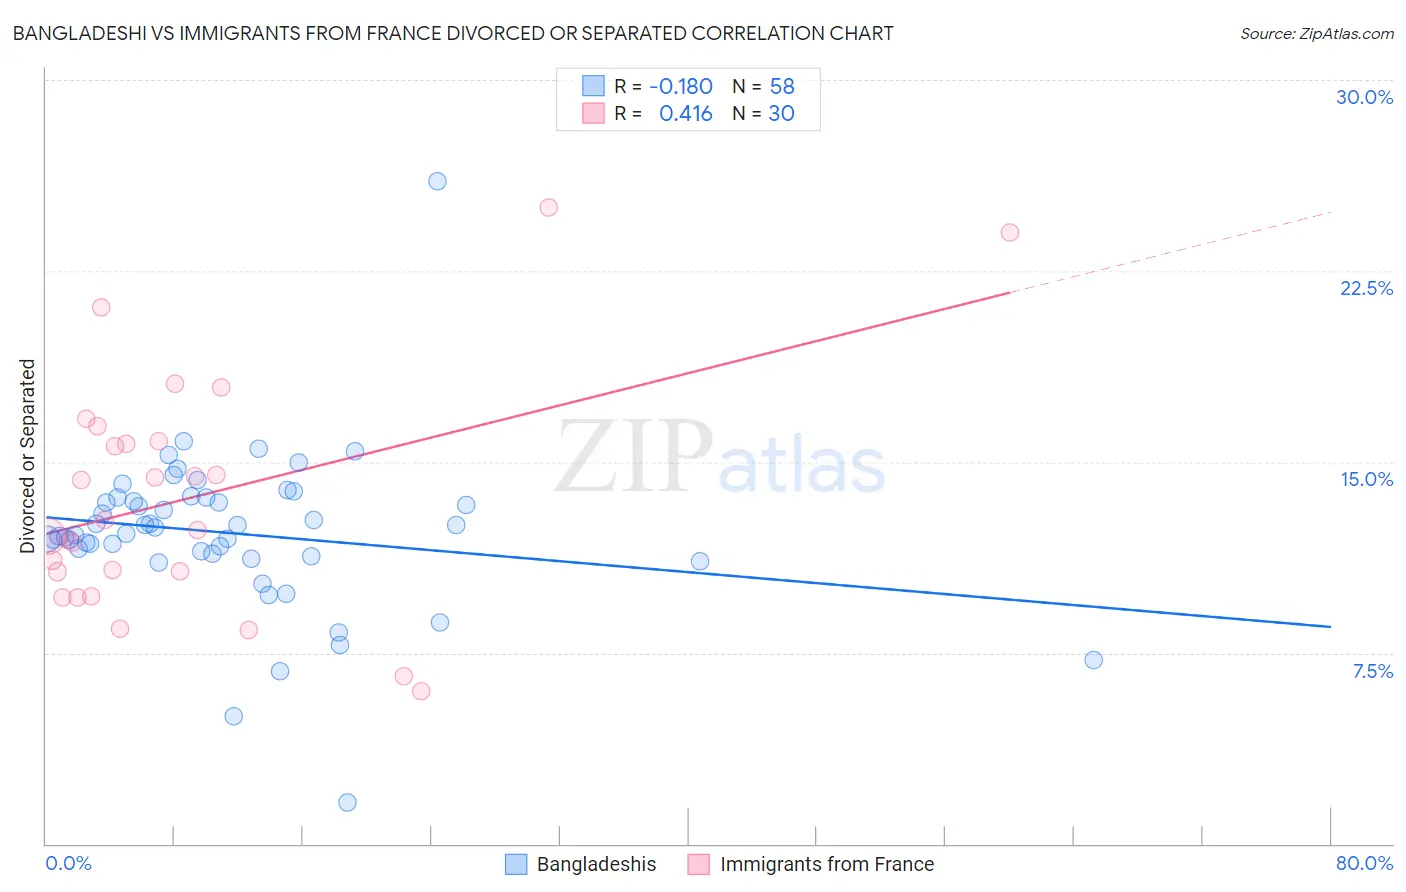
Bangladeshi vs Immigrants from France Divorced or Separated Correlation Chart
The statistical analysis conducted on geographies consisting of 141,409,827 people shows a poor negative correlation between the proportion of Bangladeshis and percentage of population currently divorced or separated in the United States with a correlation coefficient (R) of -0.180 and weighted average of 12.3%. Similarly, the statistical analysis conducted on geographies consisting of 287,864,701 people shows a moderate positive correlation between the proportion of Immigrants from France and percentage of population currently divorced or separated in the United States with a correlation coefficient (R) of 0.416 and weighted average of 11.7%, a difference of 4.9%.
Divorced or Separated Correlation Summary
| Measurement | Bangladeshi | Immigrants from France |
| Minimum | 1.6% | 6.0% |
| Maximum | 26.0% | 25.0% |
| Range | 24.4% | 19.0% |
| Mean | 12.2% | 13.6% |
| Median | 12.3% | 12.5% |
| Interquartile 25% (IQ1) | 11.4% | 10.7% |
| Interquartile 75% (IQ3) | 13.6% | 15.8% |
| Interquartile Range (IQR) | 2.2% | 5.1% |
| Standard Deviation (Sample) | 3.2% | 4.6% |
| Standard Deviation (Population) | 3.1% | 4.5% |
Similar Demographics by Divorced or Separated
Demographics Similar to Bangladeshis by Divorced or Separated
In terms of divorced or separated, the demographic groups most similar to Bangladeshis are Scandinavian (12.3%, a difference of 0.010%), Guamanian/Chamorro (12.3%, a difference of 0.070%), Immigrants from the Azores (12.3%, a difference of 0.070%), Belgian (12.3%, a difference of 0.080%), and British (12.3%, a difference of 0.10%).
| Demographics | Rating | Rank | Divorced or Separated |
| Europeans | 15.4 /100 | #215 | Poor 12.2% |
| Immigrants | South America | 15.4 /100 | #216 | Poor 12.2% |
| Northern Europeans | 14.7 /100 | #217 | Poor 12.2% |
| Slovenes | 13.2 /100 | #218 | Poor 12.3% |
| Czechoslovakians | 11.7 /100 | #219 | Poor 12.3% |
| British | 11.6 /100 | #220 | Poor 12.3% |
| Guamanians/Chamorros | 11.3 /100 | #221 | Poor 12.3% |
| Bangladeshis | 10.5 /100 | #222 | Poor 12.3% |
| Scandinavians | 10.4 /100 | #223 | Poor 12.3% |
| Immigrants | Azores | 9.7 /100 | #224 | Tragic 12.3% |
| Belgians | 9.7 /100 | #225 | Tragic 12.3% |
| Immigrants | Western Africa | 9.3 /100 | #226 | Tragic 12.3% |
| Hmong | 8.8 /100 | #227 | Tragic 12.3% |
| Immigrants | Cameroon | 8.3 /100 | #228 | Tragic 12.3% |
| Immigrants | Sudan | 8.2 /100 | #229 | Tragic 12.3% |
Demographics Similar to Immigrants from France by Divorced or Separated
In terms of divorced or separated, the demographic groups most similar to Immigrants from France are Estonian (11.7%, a difference of 0.0%), Immigrants from Spain (11.7%, a difference of 0.050%), Immigrants from South Africa (11.7%, a difference of 0.090%), Immigrants from Czechoslovakia (11.7%, a difference of 0.090%), and Greek (11.7%, a difference of 0.10%).
| Demographics | Rating | Rank | Divorced or Separated |
| Immigrants | El Salvador | 97.9 /100 | #105 | Exceptional 11.7% |
| Immigrants | Kazakhstan | 97.8 /100 | #106 | Exceptional 11.7% |
| Native Hawaiians | 97.2 /100 | #107 | Exceptional 11.7% |
| Greeks | 96.9 /100 | #108 | Exceptional 11.7% |
| Immigrants | South Africa | 96.9 /100 | #109 | Exceptional 11.7% |
| Immigrants | Czechoslovakia | 96.9 /100 | #110 | Exceptional 11.7% |
| Immigrants | Spain | 96.8 /100 | #111 | Exceptional 11.7% |
| Immigrants | France | 96.6 /100 | #112 | Exceptional 11.7% |
| Estonians | 96.6 /100 | #113 | Exceptional 11.7% |
| Immigrants | Norway | 95.9 /100 | #114 | Exceptional 11.7% |
| Lithuanians | 95.7 /100 | #115 | Exceptional 11.7% |
| Immigrants | Iraq | 95.4 /100 | #116 | Exceptional 11.7% |
| Immigrants | Uganda | 95.3 /100 | #117 | Exceptional 11.7% |
| Ecuadorians | 95.3 /100 | #118 | Exceptional 11.7% |
| Syrians | 95.1 /100 | #119 | Exceptional 11.7% |