Scottish vs Immigrants from Switzerland Divorced or Separated
COMPARE
Scottish
Immigrants from Switzerland
Divorced or Separated
Divorced or Separated Comparison
Scottish
Immigrants from Switzerland
12.6%
DIVORCED OR SEPARATED
0.4/ 100
METRIC RATING
267th/ 347
METRIC RANK
11.5%
DIVORCED OR SEPARATED
99.4/ 100
METRIC RATING
80th/ 347
METRIC RANK
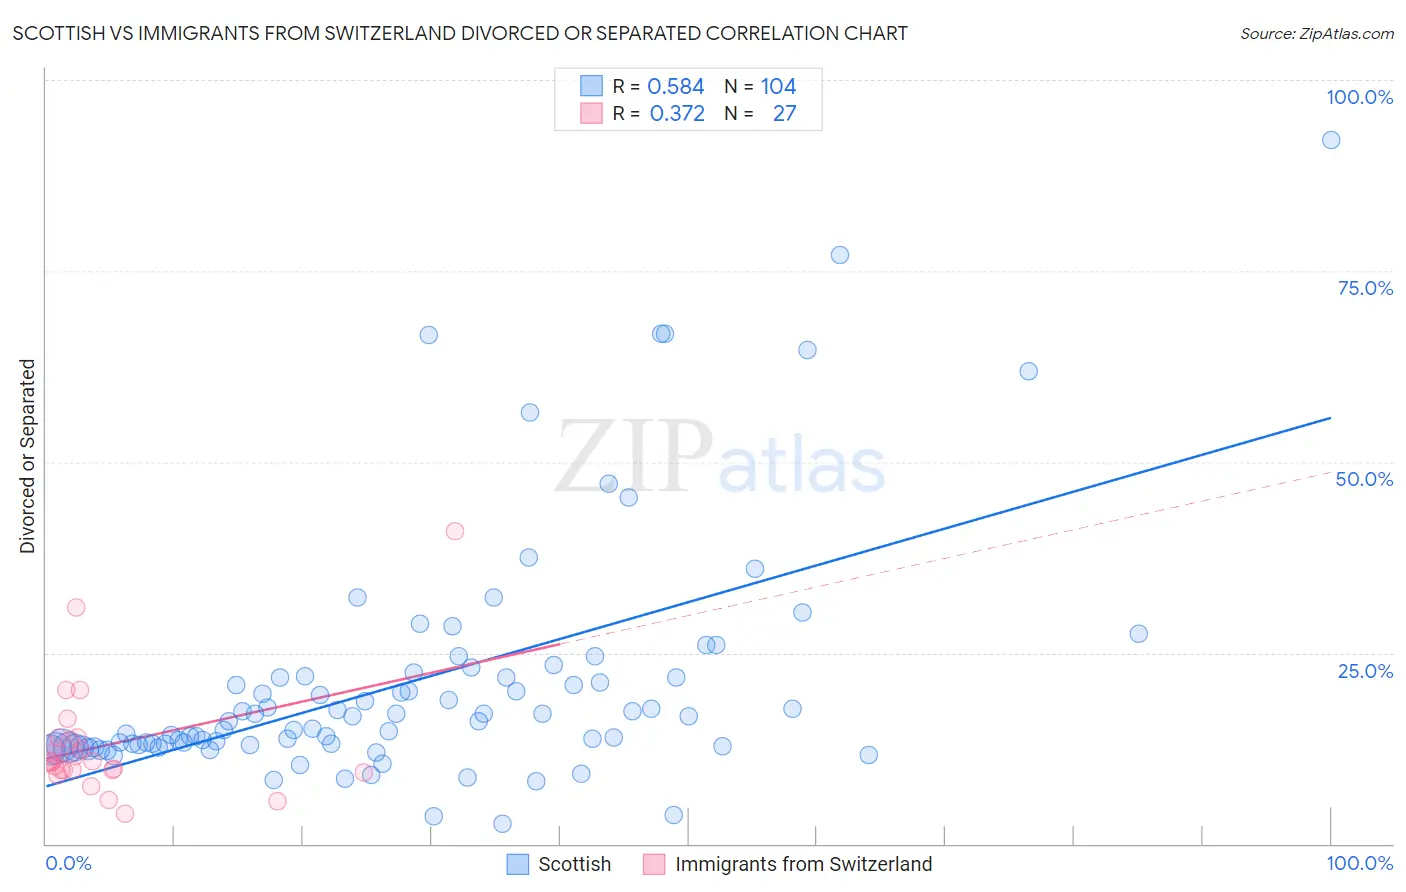
Scottish vs Immigrants from Switzerland Divorced or Separated Correlation Chart
The statistical analysis conducted on geographies consisting of 566,665,399 people shows a substantial positive correlation between the proportion of Scottish and percentage of population currently divorced or separated in the United States with a correlation coefficient (R) of 0.584 and weighted average of 12.6%. Similarly, the statistical analysis conducted on geographies consisting of 148,058,792 people shows a mild positive correlation between the proportion of Immigrants from Switzerland and percentage of population currently divorced or separated in the United States with a correlation coefficient (R) of 0.372 and weighted average of 11.5%, a difference of 9.6%.
Divorced or Separated Correlation Summary
| Measurement | Scottish | Immigrants from Switzerland |
| Minimum | 2.6% | 4.0% |
| Maximum | 92.2% | 40.9% |
| Range | 89.6% | 36.9% |
| Mean | 21.2% | 12.9% |
| Median | 16.0% | 10.8% |
| Interquartile 25% (IQ1) | 12.8% | 9.6% |
| Interquartile 75% (IQ3) | 21.8% | 13.9% |
| Interquartile Range (IQR) | 9.1% | 4.3% |
| Standard Deviation (Sample) | 16.0% | 7.7% |
| Standard Deviation (Population) | 15.9% | 7.6% |
Similar Demographics by Divorced or Separated
Demographics Similar to Scottish by Divorced or Separated
In terms of divorced or separated, the demographic groups most similar to Scottish are Fijian (12.6%, a difference of 0.010%), Immigrants from Liberia (12.6%, a difference of 0.030%), White/Caucasian (12.6%, a difference of 0.040%), Immigrants from Senegal (12.6%, a difference of 0.050%), and English (12.6%, a difference of 0.070%).
| Demographics | Rating | Rank | Divorced or Separated |
| Immigrants | Uruguay | 0.6 /100 | #260 | Tragic 12.6% |
| Immigrants | Dominica | 0.5 /100 | #261 | Tragic 12.6% |
| Basques | 0.5 /100 | #262 | Tragic 12.6% |
| Immigrants | Panama | 0.5 /100 | #263 | Tragic 12.6% |
| English | 0.5 /100 | #264 | Tragic 12.6% |
| Immigrants | Senegal | 0.5 /100 | #265 | Tragic 12.6% |
| Whites/Caucasians | 0.5 /100 | #266 | Tragic 12.6% |
| Scottish | 0.4 /100 | #267 | Tragic 12.6% |
| Fijians | 0.4 /100 | #268 | Tragic 12.6% |
| Immigrants | Liberia | 0.4 /100 | #269 | Tragic 12.6% |
| Ute | 0.4 /100 | #270 | Tragic 12.6% |
| Panamanians | 0.3 /100 | #271 | Tragic 12.7% |
| Immigrants | Middle Africa | 0.3 /100 | #272 | Tragic 12.7% |
| Immigrants | Micronesia | 0.3 /100 | #273 | Tragic 12.7% |
| Bermudans | 0.3 /100 | #274 | Tragic 12.7% |
Demographics Similar to Immigrants from Switzerland by Divorced or Separated
In terms of divorced or separated, the demographic groups most similar to Immigrants from Switzerland are Russian (11.5%, a difference of 0.010%), Guyanese (11.5%, a difference of 0.020%), Afghan (11.5%, a difference of 0.060%), Immigrants from Romania (11.5%, a difference of 0.090%), and Immigrants from Bulgaria (11.5%, a difference of 0.12%).
| Demographics | Rating | Rank | Divorced or Separated |
| Immigrants | North Macedonia | 99.6 /100 | #73 | Exceptional 11.5% |
| Taiwanese | 99.6 /100 | #74 | Exceptional 11.5% |
| Immigrants | Northern Africa | 99.6 /100 | #75 | Exceptional 11.5% |
| Albanians | 99.6 /100 | #76 | Exceptional 11.5% |
| Immigrants | Italy | 99.5 /100 | #77 | Exceptional 11.5% |
| Afghans | 99.4 /100 | #78 | Exceptional 11.5% |
| Guyanese | 99.4 /100 | #79 | Exceptional 11.5% |
| Immigrants | Switzerland | 99.4 /100 | #80 | Exceptional 11.5% |
| Russians | 99.4 /100 | #81 | Exceptional 11.5% |
| Immigrants | Romania | 99.3 /100 | #82 | Exceptional 11.5% |
| Immigrants | Bulgaria | 99.3 /100 | #83 | Exceptional 11.5% |
| Bulgarians | 99.3 /100 | #84 | Exceptional 11.5% |
| Immigrants | Albania | 99.3 /100 | #85 | Exceptional 11.5% |
| Immigrants | Latvia | 99.2 /100 | #86 | Exceptional 11.6% |
| Immigrants | Nepal | 99.2 /100 | #87 | Exceptional 11.6% |