Immigrants from France vs Cypriot Divorced or Separated
COMPARE
Immigrants from France
Cypriot
Divorced or Separated
Divorced or Separated Comparison
Immigrants from France
Cypriots
11.7%
DIVORCED OR SEPARATED
96.6/ 100
METRIC RATING
112th/ 347
METRIC RANK
10.5%
DIVORCED OR SEPARATED
100.0/ 100
METRIC RATING
13th/ 347
METRIC RANK
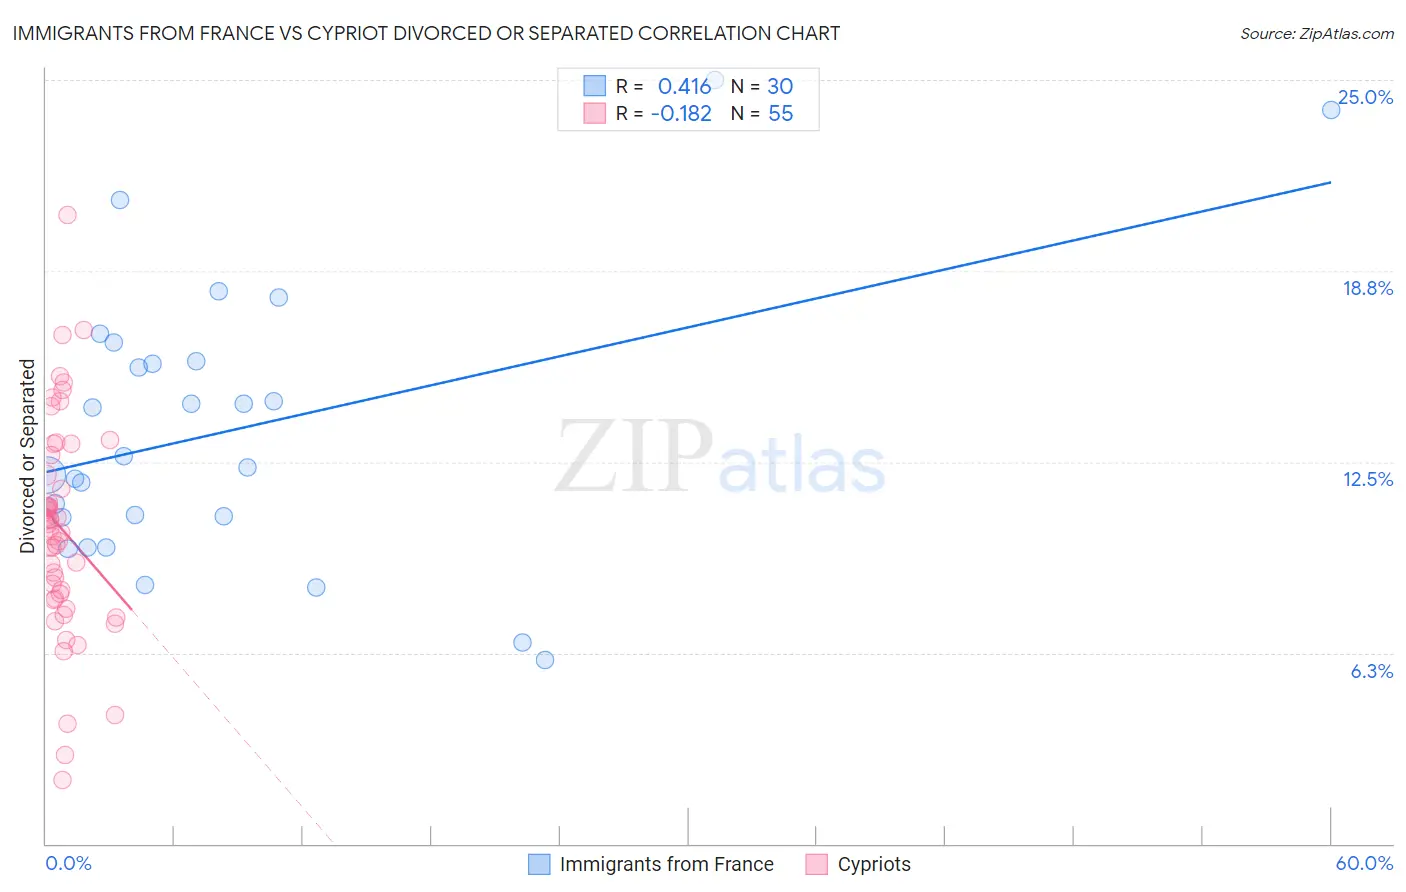
Immigrants from France vs Cypriot Divorced or Separated Correlation Chart
The statistical analysis conducted on geographies consisting of 287,864,701 people shows a moderate positive correlation between the proportion of Immigrants from France and percentage of population currently divorced or separated in the United States with a correlation coefficient (R) of 0.416 and weighted average of 11.7%. Similarly, the statistical analysis conducted on geographies consisting of 61,840,758 people shows a poor negative correlation between the proportion of Cypriots and percentage of population currently divorced or separated in the United States with a correlation coefficient (R) of -0.182 and weighted average of 10.5%, a difference of 11.7%.
Divorced or Separated Correlation Summary
| Measurement | Immigrants from France | Cypriot |
| Minimum | 6.0% | 2.1% |
| Maximum | 25.0% | 20.6% |
| Range | 19.0% | 18.5% |
| Mean | 13.6% | 10.3% |
| Median | 12.5% | 10.3% |
| Interquartile 25% (IQ1) | 10.7% | 8.0% |
| Interquartile 75% (IQ3) | 15.8% | 12.7% |
| Interquartile Range (IQR) | 5.1% | 4.7% |
| Standard Deviation (Sample) | 4.6% | 3.5% |
| Standard Deviation (Population) | 4.5% | 3.5% |
Similar Demographics by Divorced or Separated
Demographics Similar to Immigrants from France by Divorced or Separated
In terms of divorced or separated, the demographic groups most similar to Immigrants from France are Estonian (11.7%, a difference of 0.0%), Immigrants from Spain (11.7%, a difference of 0.050%), Immigrants from South Africa (11.7%, a difference of 0.090%), Immigrants from Czechoslovakia (11.7%, a difference of 0.090%), and Greek (11.7%, a difference of 0.10%).
| Demographics | Rating | Rank | Divorced or Separated |
| Immigrants | El Salvador | 97.9 /100 | #105 | Exceptional 11.7% |
| Immigrants | Kazakhstan | 97.8 /100 | #106 | Exceptional 11.7% |
| Native Hawaiians | 97.2 /100 | #107 | Exceptional 11.7% |
| Greeks | 96.9 /100 | #108 | Exceptional 11.7% |
| Immigrants | South Africa | 96.9 /100 | #109 | Exceptional 11.7% |
| Immigrants | Czechoslovakia | 96.9 /100 | #110 | Exceptional 11.7% |
| Immigrants | Spain | 96.8 /100 | #111 | Exceptional 11.7% |
| Immigrants | France | 96.6 /100 | #112 | Exceptional 11.7% |
| Estonians | 96.6 /100 | #113 | Exceptional 11.7% |
| Immigrants | Norway | 95.9 /100 | #114 | Exceptional 11.7% |
| Lithuanians | 95.7 /100 | #115 | Exceptional 11.7% |
| Immigrants | Iraq | 95.4 /100 | #116 | Exceptional 11.7% |
| Immigrants | Uganda | 95.3 /100 | #117 | Exceptional 11.7% |
| Ecuadorians | 95.3 /100 | #118 | Exceptional 11.7% |
| Syrians | 95.1 /100 | #119 | Exceptional 11.7% |
Demographics Similar to Cypriots by Divorced or Separated
In terms of divorced or separated, the demographic groups most similar to Cypriots are Okinawan (10.5%, a difference of 0.16%), Immigrants from South Central Asia (10.4%, a difference of 0.49%), Assyrian/Chaldean/Syriac (10.6%, a difference of 0.74%), Immigrants from Armenia (10.6%, a difference of 0.81%), and Immigrants from Korea (10.6%, a difference of 1.3%).
| Demographics | Rating | Rank | Divorced or Separated |
| Indians (Asian) | 100.0 /100 | #6 | Exceptional 10.2% |
| Thais | 100.0 /100 | #7 | Exceptional 10.2% |
| Immigrants | Eastern Asia | 100.0 /100 | #8 | Exceptional 10.2% |
| Yup'ik | 100.0 /100 | #9 | Exceptional 10.3% |
| Immigrants | Singapore | 100.0 /100 | #10 | Exceptional 10.3% |
| Immigrants | South Central Asia | 100.0 /100 | #11 | Exceptional 10.4% |
| Okinawans | 100.0 /100 | #12 | Exceptional 10.5% |
| Cypriots | 100.0 /100 | #13 | Exceptional 10.5% |
| Assyrians/Chaldeans/Syriacs | 100.0 /100 | #14 | Exceptional 10.6% |
| Immigrants | Armenia | 100.0 /100 | #15 | Exceptional 10.6% |
| Immigrants | Korea | 100.0 /100 | #16 | Exceptional 10.6% |
| Immigrants | Israel | 100.0 /100 | #17 | Exceptional 10.6% |
| Immigrants | Iran | 100.0 /100 | #18 | Exceptional 10.6% |
| Asians | 100.0 /100 | #19 | Exceptional 10.6% |
| Burmese | 100.0 /100 | #20 | Exceptional 10.7% |