Salvadoran vs Immigrants from Nigeria Currently Married
COMPARE
Salvadoran
Immigrants from Nigeria
Currently Married
Currently Married Comparison
Salvadorans
Immigrants from Nigeria
43.5%
CURRENTLY MARRIED
0.1/ 100
METRIC RATING
270th/ 347
METRIC RANK
43.4%
CURRENTLY MARRIED
0.1/ 100
METRIC RATING
277th/ 347
METRIC RANK
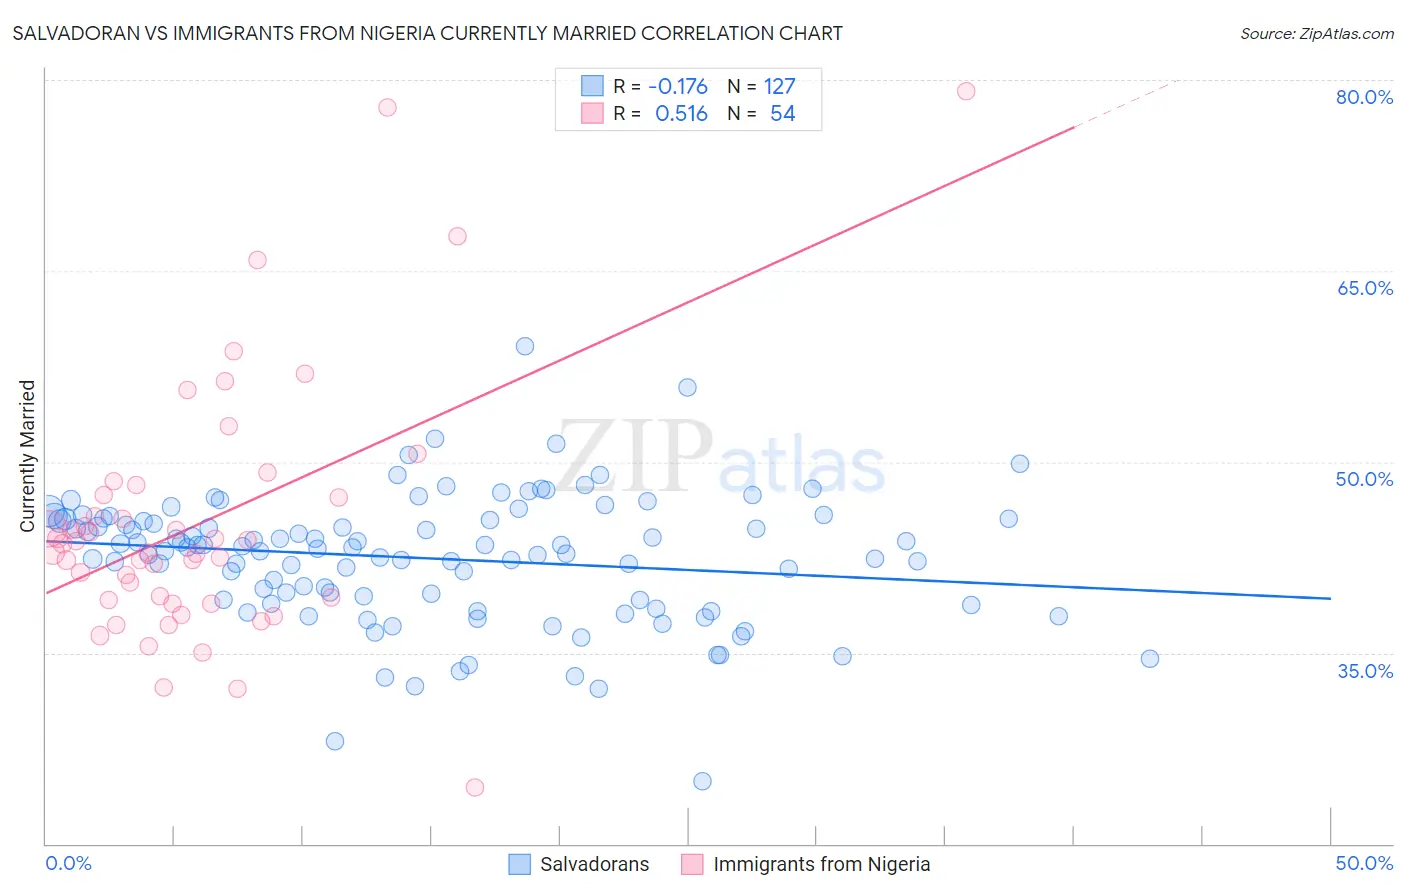
Salvadoran vs Immigrants from Nigeria Currently Married Correlation Chart
The statistical analysis conducted on geographies consisting of 399,003,710 people shows a poor negative correlation between the proportion of Salvadorans and percentage of population currently married in the United States with a correlation coefficient (R) of -0.176 and weighted average of 43.5%. Similarly, the statistical analysis conducted on geographies consisting of 283,441,157 people shows a substantial positive correlation between the proportion of Immigrants from Nigeria and percentage of population currently married in the United States with a correlation coefficient (R) of 0.516 and weighted average of 43.4%, a difference of 0.17%.
Currently Married Correlation Summary
| Measurement | Salvadoran | Immigrants from Nigeria |
| Minimum | 24.9% | 24.4% |
| Maximum | 59.1% | 79.1% |
| Range | 34.2% | 54.7% |
| Mean | 42.4% | 45.1% |
| Median | 43.2% | 43.2% |
| Interquartile 25% (IQ1) | 39.1% | 39.2% |
| Interquartile 75% (IQ3) | 45.5% | 47.4% |
| Interquartile Range (IQR) | 6.4% | 8.3% |
| Standard Deviation (Sample) | 5.1% | 10.2% |
| Standard Deviation (Population) | 5.0% | 10.1% |
Demographics Similar to Salvadorans and Immigrants from Nigeria by Currently Married
In terms of currently married, the demographic groups most similar to Salvadorans are Bermudan (43.5%, a difference of 0.020%), Indonesian (43.5%, a difference of 0.050%), Immigrants from Sudan (43.5%, a difference of 0.080%), Yaqui (43.4%, a difference of 0.10%), and Nigerian (43.4%, a difference of 0.11%). Similarly, the demographic groups most similar to Immigrants from Nigeria are Sierra Leonean (43.4%, a difference of 0.010%), Colville (43.4%, a difference of 0.040%), Nigerian (43.4%, a difference of 0.060%), Yaqui (43.4%, a difference of 0.070%), and Indonesian (43.5%, a difference of 0.12%).
| Demographics | Rating | Rank | Currently Married |
| Immigrants | Cuba | 0.1 /100 | #263 | Tragic 43.7% |
| Sudanese | 0.1 /100 | #264 | Tragic 43.7% |
| Immigrants | Bangladesh | 0.1 /100 | #265 | Tragic 43.6% |
| Ecuadorians | 0.1 /100 | #266 | Tragic 43.6% |
| Immigrants | Eritrea | 0.1 /100 | #267 | Tragic 43.6% |
| Spanish American Indians | 0.1 /100 | #268 | Tragic 43.6% |
| Immigrants | Sudan | 0.1 /100 | #269 | Tragic 43.5% |
| Salvadorans | 0.1 /100 | #270 | Tragic 43.5% |
| Bermudans | 0.1 /100 | #271 | Tragic 43.5% |
| Indonesians | 0.1 /100 | #272 | Tragic 43.5% |
| Yaqui | 0.1 /100 | #273 | Tragic 43.4% |
| Nigerians | 0.1 /100 | #274 | Tragic 43.4% |
| Colville | 0.1 /100 | #275 | Tragic 43.4% |
| Sierra Leoneans | 0.1 /100 | #276 | Tragic 43.4% |
| Immigrants | Nigeria | 0.1 /100 | #277 | Tragic 43.4% |
| Central Americans | 0.0 /100 | #278 | Tragic 43.3% |
| Central American Indians | 0.0 /100 | #279 | Tragic 43.3% |
| Apache | 0.0 /100 | #280 | Tragic 43.2% |
| Chippewa | 0.0 /100 | #281 | Tragic 43.2% |
| Immigrants | Ecuador | 0.0 /100 | #282 | Tragic 43.2% |
| Kiowa | 0.0 /100 | #283 | Tragic 43.2% |