Salvadoran vs Hawaiian Currently Married
COMPARE
Salvadoran
Hawaiian
Currently Married
Currently Married Comparison
Salvadorans
Hawaiians
43.5%
CURRENTLY MARRIED
0.1/ 100
METRIC RATING
270th/ 347
METRIC RANK
46.6%
CURRENTLY MARRIED
48.6/ 100
METRIC RATING
176th/ 347
METRIC RANK
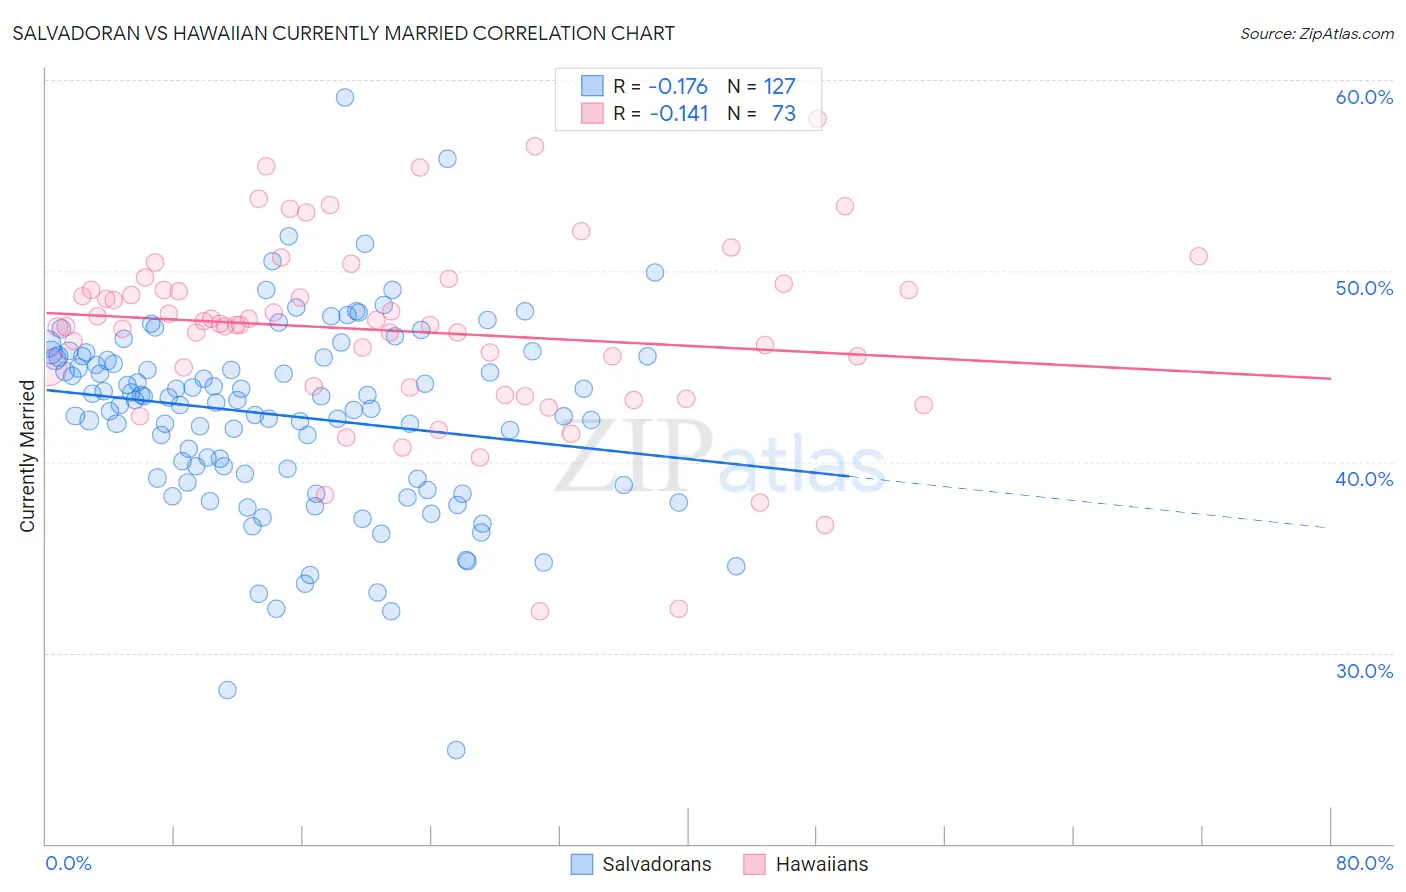
Salvadoran vs Hawaiian Currently Married Correlation Chart
The statistical analysis conducted on geographies consisting of 399,003,710 people shows a poor negative correlation between the proportion of Salvadorans and percentage of population currently married in the United States with a correlation coefficient (R) of -0.176 and weighted average of 43.5%. Similarly, the statistical analysis conducted on geographies consisting of 327,570,403 people shows a poor negative correlation between the proportion of Hawaiians and percentage of population currently married in the United States with a correlation coefficient (R) of -0.141 and weighted average of 46.6%, a difference of 7.2%.
Currently Married Correlation Summary
| Measurement | Salvadoran | Hawaiian |
| Minimum | 24.9% | 32.2% |
| Maximum | 59.1% | 58.0% |
| Range | 34.2% | 25.8% |
| Mean | 42.4% | 46.9% |
| Median | 43.2% | 47.2% |
| Interquartile 25% (IQ1) | 39.1% | 43.9% |
| Interquartile 75% (IQ3) | 45.5% | 49.2% |
| Interquartile Range (IQR) | 6.4% | 5.2% |
| Standard Deviation (Sample) | 5.1% | 4.9% |
| Standard Deviation (Population) | 5.0% | 4.9% |
Similar Demographics by Currently Married
Demographics Similar to Salvadorans by Currently Married
In terms of currently married, the demographic groups most similar to Salvadorans are Bermudan (43.5%, a difference of 0.020%), Indonesian (43.5%, a difference of 0.050%), Immigrants from Sudan (43.5%, a difference of 0.080%), Yaqui (43.4%, a difference of 0.10%), and Nigerian (43.4%, a difference of 0.11%).
| Demographics | Rating | Rank | Currently Married |
| Immigrants | Cuba | 0.1 /100 | #263 | Tragic 43.7% |
| Sudanese | 0.1 /100 | #264 | Tragic 43.7% |
| Immigrants | Bangladesh | 0.1 /100 | #265 | Tragic 43.6% |
| Ecuadorians | 0.1 /100 | #266 | Tragic 43.6% |
| Immigrants | Eritrea | 0.1 /100 | #267 | Tragic 43.6% |
| Spanish American Indians | 0.1 /100 | #268 | Tragic 43.6% |
| Immigrants | Sudan | 0.1 /100 | #269 | Tragic 43.5% |
| Salvadorans | 0.1 /100 | #270 | Tragic 43.5% |
| Bermudans | 0.1 /100 | #271 | Tragic 43.5% |
| Indonesians | 0.1 /100 | #272 | Tragic 43.5% |
| Yaqui | 0.1 /100 | #273 | Tragic 43.4% |
| Nigerians | 0.1 /100 | #274 | Tragic 43.4% |
| Colville | 0.1 /100 | #275 | Tragic 43.4% |
| Sierra Leoneans | 0.1 /100 | #276 | Tragic 43.4% |
| Immigrants | Nigeria | 0.1 /100 | #277 | Tragic 43.4% |
Demographics Similar to Hawaiians by Currently Married
In terms of currently married, the demographic groups most similar to Hawaiians are Israeli (46.6%, a difference of 0.0%), Chickasaw (46.6%, a difference of 0.030%), Peruvian (46.6%, a difference of 0.050%), Immigrants from Brazil (46.6%, a difference of 0.050%), and Tlingit-Haida (46.7%, a difference of 0.090%).
| Demographics | Rating | Rank | Currently Married |
| Armenians | 58.2 /100 | #169 | Average 46.8% |
| Immigrants | Latvia | 56.7 /100 | #170 | Average 46.7% |
| Immigrants | Zimbabwe | 52.4 /100 | #171 | Average 46.7% |
| Aleuts | 52.0 /100 | #172 | Average 46.7% |
| Tlingit-Haida | 51.2 /100 | #173 | Average 46.7% |
| Peruvians | 50.0 /100 | #174 | Average 46.6% |
| Immigrants | Brazil | 49.9 /100 | #175 | Average 46.6% |
| Hawaiians | 48.6 /100 | #176 | Average 46.6% |
| Israelis | 48.6 /100 | #177 | Average 46.6% |
| Chickasaw | 47.8 /100 | #178 | Average 46.6% |
| Immigrants | Oceania | 44.6 /100 | #179 | Average 46.5% |
| Costa Ricans | 43.7 /100 | #180 | Average 46.5% |
| Ottawa | 43.0 /100 | #181 | Average 46.5% |
| Potawatomi | 41.9 /100 | #182 | Average 46.5% |
| Immigrants | Northern Africa | 39.7 /100 | #183 | Fair 46.5% |