Immigrants from Austria vs Immigrants from Nigeria Currently Married
COMPARE
Immigrants from Austria
Immigrants from Nigeria
Currently Married
Currently Married Comparison
Immigrants from Austria
Immigrants from Nigeria
48.5%
CURRENTLY MARRIED
98.8/ 100
METRIC RATING
53rd/ 347
METRIC RANK
43.4%
CURRENTLY MARRIED
0.1/ 100
METRIC RATING
277th/ 347
METRIC RANK
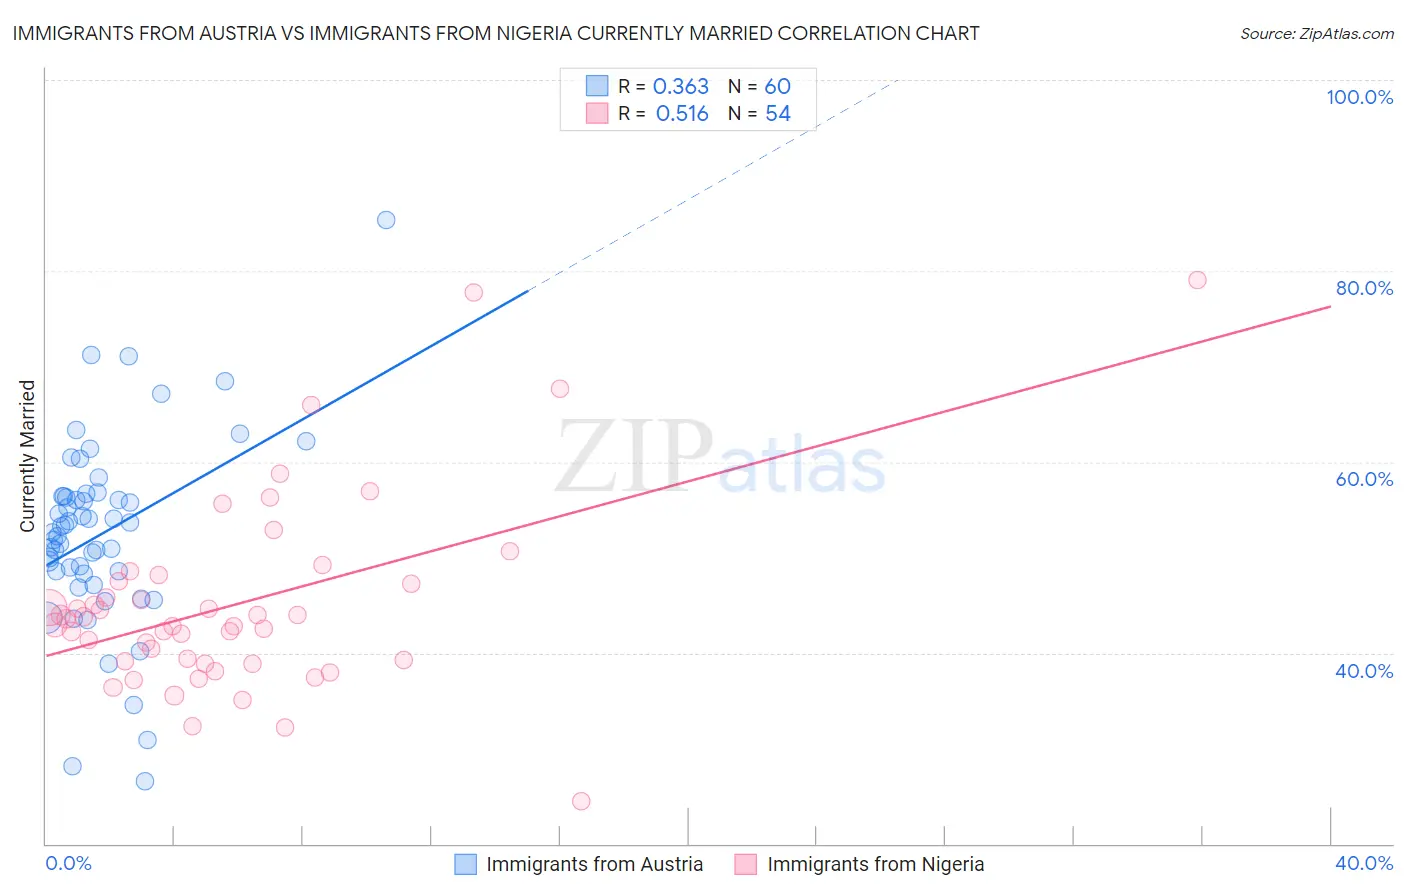
Immigrants from Austria vs Immigrants from Nigeria Currently Married Correlation Chart
The statistical analysis conducted on geographies consisting of 167,972,759 people shows a mild positive correlation between the proportion of Immigrants from Austria and percentage of population currently married in the United States with a correlation coefficient (R) of 0.363 and weighted average of 48.5%. Similarly, the statistical analysis conducted on geographies consisting of 283,441,157 people shows a substantial positive correlation between the proportion of Immigrants from Nigeria and percentage of population currently married in the United States with a correlation coefficient (R) of 0.516 and weighted average of 43.4%, a difference of 11.7%.
Currently Married Correlation Summary
| Measurement | Immigrants from Austria | Immigrants from Nigeria |
| Minimum | 26.6% | 24.4% |
| Maximum | 85.3% | 79.1% |
| Range | 58.7% | 54.7% |
| Mean | 52.5% | 45.1% |
| Median | 52.9% | 43.2% |
| Interquartile 25% (IQ1) | 48.4% | 39.2% |
| Interquartile 75% (IQ3) | 56.4% | 47.4% |
| Interquartile Range (IQR) | 8.0% | 8.3% |
| Standard Deviation (Sample) | 10.0% | 10.2% |
| Standard Deviation (Population) | 9.9% | 10.1% |
Similar Demographics by Currently Married
Demographics Similar to Immigrants from Austria by Currently Married
In terms of currently married, the demographic groups most similar to Immigrants from Austria are Immigrants from Moldova (48.5%, a difference of 0.060%), Immigrants from North Macedonia (48.5%, a difference of 0.070%), Latvian (48.5%, a difference of 0.070%), Immigrants from Netherlands (48.5%, a difference of 0.10%), and Russian (48.6%, a difference of 0.12%).
| Demographics | Rating | Rank | Currently Married |
| Immigrants | Iran | 99.2 /100 | #46 | Exceptional 48.7% |
| Northern Europeans | 99.2 /100 | #47 | Exceptional 48.7% |
| Austrians | 99.2 /100 | #48 | Exceptional 48.7% |
| Bhutanese | 99.1 /100 | #49 | Exceptional 48.6% |
| Iranians | 99.0 /100 | #50 | Exceptional 48.6% |
| Whites/Caucasians | 99.0 /100 | #51 | Exceptional 48.6% |
| Russians | 98.9 /100 | #52 | Exceptional 48.6% |
| Immigrants | Austria | 98.8 /100 | #53 | Exceptional 48.5% |
| Immigrants | Moldova | 98.7 /100 | #54 | Exceptional 48.5% |
| Immigrants | North Macedonia | 98.7 /100 | #55 | Exceptional 48.5% |
| Latvians | 98.7 /100 | #56 | Exceptional 48.5% |
| Immigrants | Netherlands | 98.6 /100 | #57 | Exceptional 48.5% |
| French | 98.6 /100 | #58 | Exceptional 48.4% |
| Immigrants | Ireland | 98.5 /100 | #59 | Exceptional 48.4% |
| Immigrants | Romania | 98.5 /100 | #60 | Exceptional 48.4% |
Demographics Similar to Immigrants from Nigeria by Currently Married
In terms of currently married, the demographic groups most similar to Immigrants from Nigeria are Sierra Leonean (43.4%, a difference of 0.010%), Colville (43.4%, a difference of 0.040%), Nigerian (43.4%, a difference of 0.060%), Yaqui (43.4%, a difference of 0.070%), and Indonesian (43.5%, a difference of 0.12%).
| Demographics | Rating | Rank | Currently Married |
| Salvadorans | 0.1 /100 | #270 | Tragic 43.5% |
| Bermudans | 0.1 /100 | #271 | Tragic 43.5% |
| Indonesians | 0.1 /100 | #272 | Tragic 43.5% |
| Yaqui | 0.1 /100 | #273 | Tragic 43.4% |
| Nigerians | 0.1 /100 | #274 | Tragic 43.4% |
| Colville | 0.1 /100 | #275 | Tragic 43.4% |
| Sierra Leoneans | 0.1 /100 | #276 | Tragic 43.4% |
| Immigrants | Nigeria | 0.1 /100 | #277 | Tragic 43.4% |
| Central Americans | 0.0 /100 | #278 | Tragic 43.3% |
| Central American Indians | 0.0 /100 | #279 | Tragic 43.3% |
| Apache | 0.0 /100 | #280 | Tragic 43.2% |
| Chippewa | 0.0 /100 | #281 | Tragic 43.2% |
| Immigrants | Ecuador | 0.0 /100 | #282 | Tragic 43.2% |
| Kiowa | 0.0 /100 | #283 | Tragic 43.2% |
| Immigrants | El Salvador | 0.0 /100 | #284 | Tragic 43.1% |