Potawatomi vs Assyrian/Chaldean/Syriac Family Households
COMPARE
Potawatomi
Assyrian/Chaldean/Syriac
Family Households
Family Households Comparison
Potawatomi
Assyrians/Chaldeans/Syriacs
63.3%
FAMILY HOUSEHOLDS
1.0/ 100
METRIC RATING
255th/ 347
METRIC RANK
68.2%
FAMILY HOUSEHOLDS
100.0/ 100
METRIC RATING
15th/ 347
METRIC RANK
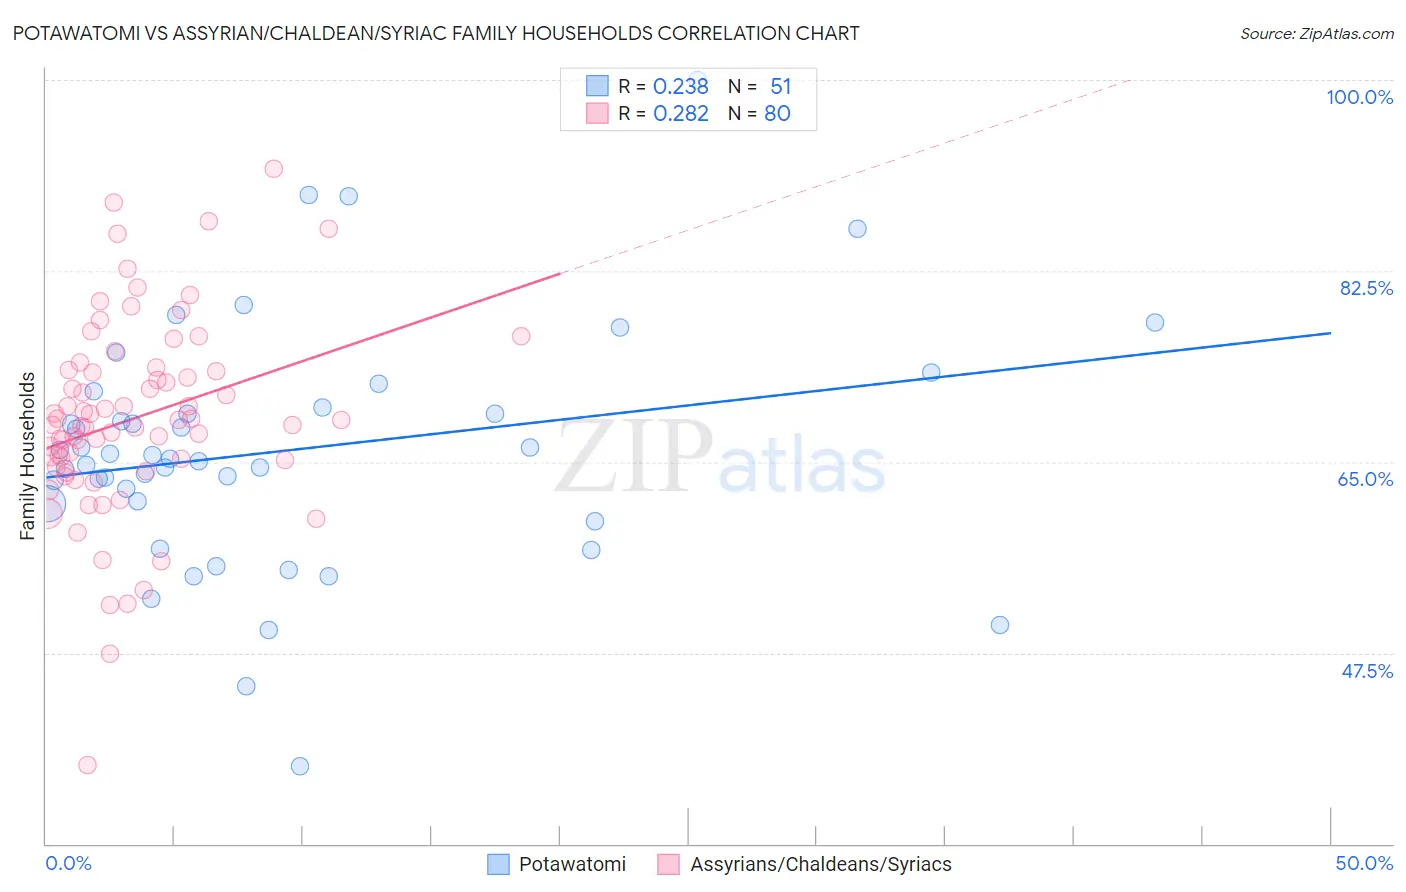
Potawatomi vs Assyrian/Chaldean/Syriac Family Households Correlation Chart
The statistical analysis conducted on geographies consisting of 117,759,902 people shows a weak positive correlation between the proportion of Potawatomi and percentage of family households in the United States with a correlation coefficient (R) of 0.238 and weighted average of 63.3%. Similarly, the statistical analysis conducted on geographies consisting of 110,294,582 people shows a weak positive correlation between the proportion of Assyrians/Chaldeans/Syriacs and percentage of family households in the United States with a correlation coefficient (R) of 0.282 and weighted average of 68.2%, a difference of 7.7%.
Family Households Correlation Summary
| Measurement | Potawatomi | Assyrian/Chaldean/Syriac |
| Minimum | 37.1% | 37.2% |
| Maximum | 100.0% | 91.9% |
| Range | 62.9% | 54.6% |
| Mean | 66.1% | 69.0% |
| Median | 65.3% | 68.6% |
| Interquartile 25% (IQ1) | 61.2% | 64.9% |
| Interquartile 75% (IQ3) | 70.0% | 73.4% |
| Interquartile Range (IQR) | 8.8% | 8.5% |
| Standard Deviation (Sample) | 11.3% | 9.1% |
| Standard Deviation (Population) | 11.2% | 9.0% |
Similar Demographics by Family Households
Demographics Similar to Potawatomi by Family Households
In terms of family households, the demographic groups most similar to Potawatomi are Slovak (63.3%, a difference of 0.020%), Luxembourger (63.3%, a difference of 0.020%), Immigrants from Dominican Republic (63.3%, a difference of 0.030%), Bahamian (63.3%, a difference of 0.050%), and Icelander (63.3%, a difference of 0.060%).
| Demographics | Rating | Rank | Family Households |
| Dominicans | 1.5 /100 | #248 | Tragic 63.4% |
| Russians | 1.4 /100 | #249 | Tragic 63.4% |
| Immigrants | Japan | 1.4 /100 | #250 | Tragic 63.4% |
| Taiwanese | 1.2 /100 | #251 | Tragic 63.3% |
| Bahamians | 1.1 /100 | #252 | Tragic 63.3% |
| Immigrants | Dominican Republic | 1.0 /100 | #253 | Tragic 63.3% |
| Slovaks | 1.0 /100 | #254 | Tragic 63.3% |
| Potawatomi | 1.0 /100 | #255 | Tragic 63.3% |
| Luxembourgers | 0.9 /100 | #256 | Tragic 63.3% |
| Icelanders | 0.8 /100 | #257 | Tragic 63.3% |
| Immigrants | Barbados | 0.7 /100 | #258 | Tragic 63.2% |
| Immigrants | Western Europe | 0.6 /100 | #259 | Tragic 63.2% |
| Cypriots | 0.6 /100 | #260 | Tragic 63.2% |
| Immigrants | Russia | 0.6 /100 | #261 | Tragic 63.2% |
| Immigrants | Ireland | 0.6 /100 | #262 | Tragic 63.2% |
Demographics Similar to Assyrians/Chaldeans/Syriacs by Family Households
In terms of family households, the demographic groups most similar to Assyrians/Chaldeans/Syriacs are Immigrants from Vietnam (68.2%, a difference of 0.0%), Chinese (68.1%, a difference of 0.040%), Immigrants from Cuba (68.2%, a difference of 0.060%), Pueblo (68.2%, a difference of 0.070%), and Korean (68.3%, a difference of 0.15%).
| Demographics | Rating | Rank | Family Households |
| Immigrants | Fiji | 100.0 /100 | #8 | Exceptional 68.8% |
| Native Hawaiians | 100.0 /100 | #9 | Exceptional 68.4% |
| Immigrants | Philippines | 100.0 /100 | #10 | Exceptional 68.3% |
| Immigrants | Central America | 100.0 /100 | #11 | Exceptional 68.3% |
| Koreans | 100.0 /100 | #12 | Exceptional 68.3% |
| Pueblo | 100.0 /100 | #13 | Exceptional 68.2% |
| Immigrants | Cuba | 100.0 /100 | #14 | Exceptional 68.2% |
| Assyrians/Chaldeans/Syriacs | 100.0 /100 | #15 | Exceptional 68.2% |
| Immigrants | Vietnam | 100.0 /100 | #16 | Exceptional 68.2% |
| Chinese | 100.0 /100 | #17 | Exceptional 68.1% |
| Immigrants | Taiwan | 100.0 /100 | #18 | Exceptional 68.0% |
| Samoans | 100.0 /100 | #19 | Exceptional 67.9% |
| Inupiat | 100.0 /100 | #20 | Exceptional 67.8% |
| Cubans | 100.0 /100 | #21 | Exceptional 67.7% |
| Sri Lankans | 100.0 /100 | #22 | Exceptional 67.7% |