Portuguese vs Immigrants from Dominican Republic Family Households
COMPARE
Portuguese
Immigrants from Dominican Republic
Family Households
Family Households Comparison
Portuguese
Immigrants from Dominican Republic
65.8%
FAMILY HOUSEHOLDS
99.9/ 100
METRIC RATING
72nd/ 347
METRIC RANK
63.3%
FAMILY HOUSEHOLDS
1.0/ 100
METRIC RATING
253rd/ 347
METRIC RANK
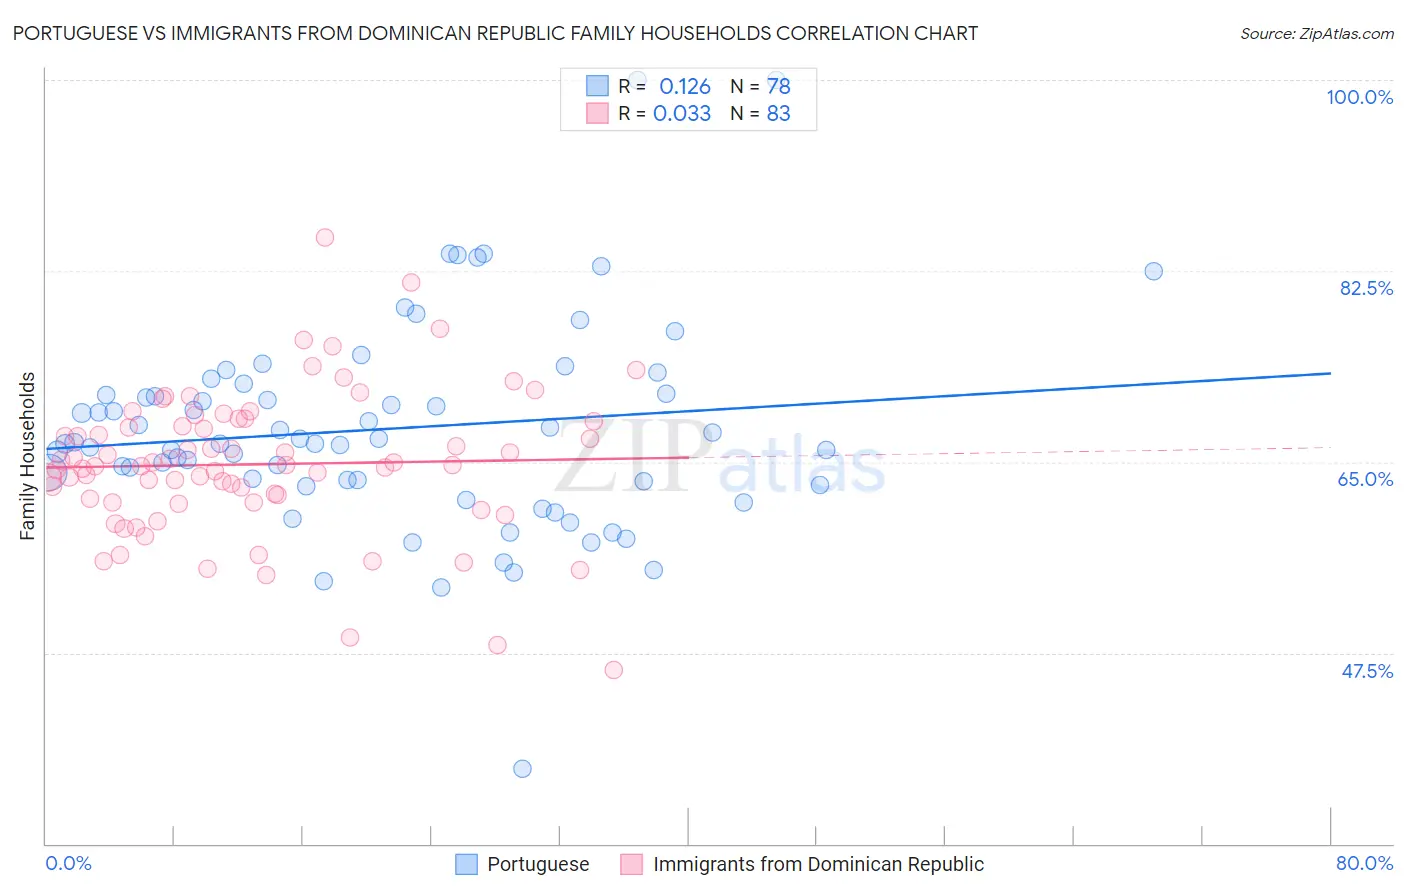
Portuguese vs Immigrants from Dominican Republic Family Households Correlation Chart
The statistical analysis conducted on geographies consisting of 449,986,685 people shows a poor positive correlation between the proportion of Portuguese and percentage of family households in the United States with a correlation coefficient (R) of 0.126 and weighted average of 65.8%. Similarly, the statistical analysis conducted on geographies consisting of 274,978,425 people shows no correlation between the proportion of Immigrants from Dominican Republic and percentage of family households in the United States with a correlation coefficient (R) of 0.033 and weighted average of 63.3%, a difference of 4.0%.
Family Households Correlation Summary
| Measurement | Portuguese | Immigrants from Dominican Republic |
| Minimum | 36.8% | 46.0% |
| Maximum | 100.0% | 85.5% |
| Range | 63.2% | 39.6% |
| Mean | 68.0% | 64.8% |
| Median | 66.8% | 64.7% |
| Interquartile 25% (IQ1) | 63.3% | 61.3% |
| Interquartile 75% (IQ3) | 71.2% | 68.7% |
| Interquartile Range (IQR) | 8.0% | 7.4% |
| Standard Deviation (Sample) | 9.6% | 6.7% |
| Standard Deviation (Population) | 9.6% | 6.6% |
Similar Demographics by Family Households
Demographics Similar to Portuguese by Family Households
In terms of family households, the demographic groups most similar to Portuguese are Bhutanese (65.9%, a difference of 0.050%), Immigrants from Afghanistan (65.9%, a difference of 0.070%), Malaysian (65.9%, a difference of 0.080%), Laotian (65.8%, a difference of 0.080%), and Japanese (65.9%, a difference of 0.11%).
| Demographics | Rating | Rank | Family Households |
| Costa Ricans | 99.9 /100 | #65 | Exceptional 65.9% |
| Fijians | 99.9 /100 | #66 | Exceptional 65.9% |
| Filipinos | 99.9 /100 | #67 | Exceptional 65.9% |
| Japanese | 99.9 /100 | #68 | Exceptional 65.9% |
| Malaysians | 99.9 /100 | #69 | Exceptional 65.9% |
| Immigrants | Afghanistan | 99.9 /100 | #70 | Exceptional 65.9% |
| Bhutanese | 99.9 /100 | #71 | Exceptional 65.9% |
| Portuguese | 99.9 /100 | #72 | Exceptional 65.8% |
| Laotians | 99.9 /100 | #73 | Exceptional 65.8% |
| Burmese | 99.9 /100 | #74 | Exceptional 65.7% |
| Houma | 99.9 /100 | #75 | Exceptional 65.7% |
| Immigrants | Azores | 99.8 /100 | #76 | Exceptional 65.6% |
| Immigrants | South America | 99.8 /100 | #77 | Exceptional 65.6% |
| Yaqui | 99.8 /100 | #78 | Exceptional 65.6% |
| Immigrants | Costa Rica | 99.8 /100 | #79 | Exceptional 65.6% |
Demographics Similar to Immigrants from Dominican Republic by Family Households
In terms of family households, the demographic groups most similar to Immigrants from Dominican Republic are Slovak (63.3%, a difference of 0.010%), Bahamian (63.3%, a difference of 0.020%), Potawatomi (63.3%, a difference of 0.030%), Taiwanese (63.3%, a difference of 0.040%), and Luxembourger (63.3%, a difference of 0.050%).
| Demographics | Rating | Rank | Family Households |
| Immigrants | Ghana | 1.6 /100 | #246 | Tragic 63.4% |
| Immigrants | Uzbekistan | 1.5 /100 | #247 | Tragic 63.4% |
| Dominicans | 1.5 /100 | #248 | Tragic 63.4% |
| Russians | 1.4 /100 | #249 | Tragic 63.4% |
| Immigrants | Japan | 1.4 /100 | #250 | Tragic 63.4% |
| Taiwanese | 1.2 /100 | #251 | Tragic 63.3% |
| Bahamians | 1.1 /100 | #252 | Tragic 63.3% |
| Immigrants | Dominican Republic | 1.0 /100 | #253 | Tragic 63.3% |
| Slovaks | 1.0 /100 | #254 | Tragic 63.3% |
| Potawatomi | 1.0 /100 | #255 | Tragic 63.3% |
| Luxembourgers | 0.9 /100 | #256 | Tragic 63.3% |
| Icelanders | 0.8 /100 | #257 | Tragic 63.3% |
| Immigrants | Barbados | 0.7 /100 | #258 | Tragic 63.2% |
| Immigrants | Western Europe | 0.6 /100 | #259 | Tragic 63.2% |
| Cypriots | 0.6 /100 | #260 | Tragic 63.2% |