Polish vs Salvadoran Unemployment Among Women with Children Under 6 years
COMPARE
Polish
Salvadoran
Unemployment Among Women with Children Under 6 years
Unemployment Among Women with Children Under 6 years Comparison
Poles
Salvadorans
7.9%
UNEMPLOYMENT AMONG WOMEN WITH CHILDREN UNDER 6 YEARS
16.0/ 100
METRIC RATING
210th/ 347
METRIC RANK
8.0%
UNEMPLOYMENT AMONG WOMEN WITH CHILDREN UNDER 6 YEARS
5.5/ 100
METRIC RATING
229th/ 347
METRIC RANK
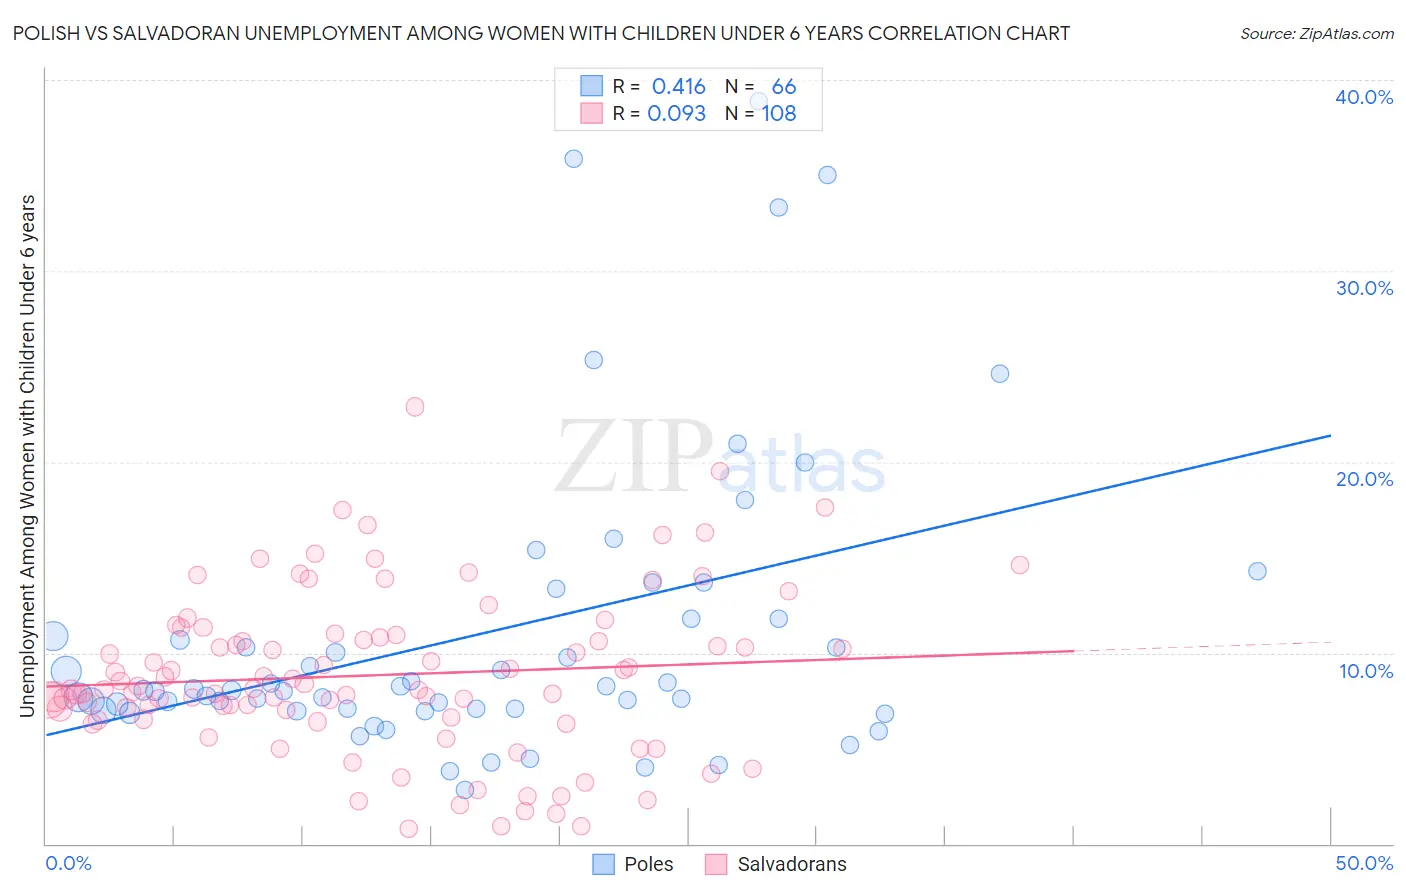
Polish vs Salvadoran Unemployment Among Women with Children Under 6 years Correlation Chart
The statistical analysis conducted on geographies consisting of 372,625,491 people shows a moderate positive correlation between the proportion of Poles and unemployment rate among women with children under the age of 6 in the United States with a correlation coefficient (R) of 0.416 and weighted average of 7.9%. Similarly, the statistical analysis conducted on geographies consisting of 311,506,560 people shows a slight positive correlation between the proportion of Salvadorans and unemployment rate among women with children under the age of 6 in the United States with a correlation coefficient (R) of 0.093 and weighted average of 8.0%, a difference of 1.9%.
Unemployment Among Women with Children Under 6 years Correlation Summary
| Measurement | Polish | Salvadoran |
| Minimum | 2.8% | 0.80% |
| Maximum | 38.9% | 22.9% |
| Range | 36.0% | 22.1% |
| Mean | 11.0% | 8.8% |
| Median | 8.0% | 8.1% |
| Interquartile 25% (IQ1) | 7.1% | 6.6% |
| Interquartile 75% (IQ3) | 11.8% | 10.9% |
| Interquartile Range (IQR) | 4.7% | 4.3% |
| Standard Deviation (Sample) | 7.8% | 4.2% |
| Standard Deviation (Population) | 7.7% | 4.2% |
Demographics Similar to Poles and Salvadorans by Unemployment Among Women with Children Under 6 years
In terms of unemployment among women with children under 6 years, the demographic groups most similar to Poles are Immigrants from Ecuador (7.9%, a difference of 0.13%), Costa Rican (7.8%, a difference of 0.18%), Swiss (7.9%, a difference of 0.50%), Scottish (7.9%, a difference of 0.63%), and Spanish (7.9%, a difference of 0.66%). Similarly, the demographic groups most similar to Salvadorans are Immigrants from Sudan (8.0%, a difference of 0.15%), Portuguese (8.0%, a difference of 0.18%), Senegalese (8.0%, a difference of 0.19%), German (8.0%, a difference of 0.41%), and English (8.0%, a difference of 0.45%).
| Demographics | Rating | Rank | Unemployment Among Women with Children Under 6 years |
| Costa Ricans | 17.6 /100 | #209 | Poor 7.8% |
| Poles | 16.0 /100 | #210 | Poor 7.9% |
| Immigrants | Ecuador | 14.9 /100 | #211 | Poor 7.9% |
| Swiss | 12.3 /100 | #212 | Poor 7.9% |
| Scottish | 11.4 /100 | #213 | Poor 7.9% |
| Spanish | 11.3 /100 | #214 | Poor 7.9% |
| Ecuadorians | 11.2 /100 | #215 | Poor 7.9% |
| Immigrants | Lebanon | 11.1 /100 | #216 | Poor 7.9% |
| Immigrants | Nigeria | 10.3 /100 | #217 | Poor 7.9% |
| Moroccans | 9.7 /100 | #218 | Tragic 7.9% |
| Arabs | 9.4 /100 | #219 | Tragic 7.9% |
| South American Indians | 9.3 /100 | #220 | Tragic 7.9% |
| Immigrants | Germany | 8.5 /100 | #221 | Tragic 7.9% |
| Samoans | 8.4 /100 | #222 | Tragic 7.9% |
| Carpatho Rusyns | 7.8 /100 | #223 | Tragic 8.0% |
| English | 7.2 /100 | #224 | Tragic 8.0% |
| Germans | 7.0 /100 | #225 | Tragic 8.0% |
| Senegalese | 6.2 /100 | #226 | Tragic 8.0% |
| Portuguese | 6.2 /100 | #227 | Tragic 8.0% |
| Immigrants | Sudan | 6.0 /100 | #228 | Tragic 8.0% |
| Salvadorans | 5.5 /100 | #229 | Tragic 8.0% |