Pima vs Immigrants from Grenada Single Father Households
COMPARE
Pima
Immigrants from Grenada
Single Father Households
Single Father Households Comparison
Pima
Immigrants from Grenada
4.2%
SINGLE FATHER HOUSEHOLDS
0.0/ 100
METRIC RATING
343rd/ 347
METRIC RANK
2.0%
SINGLE FATHER HOUSEHOLDS
100.0/ 100
METRIC RATING
43rd/ 347
METRIC RANK
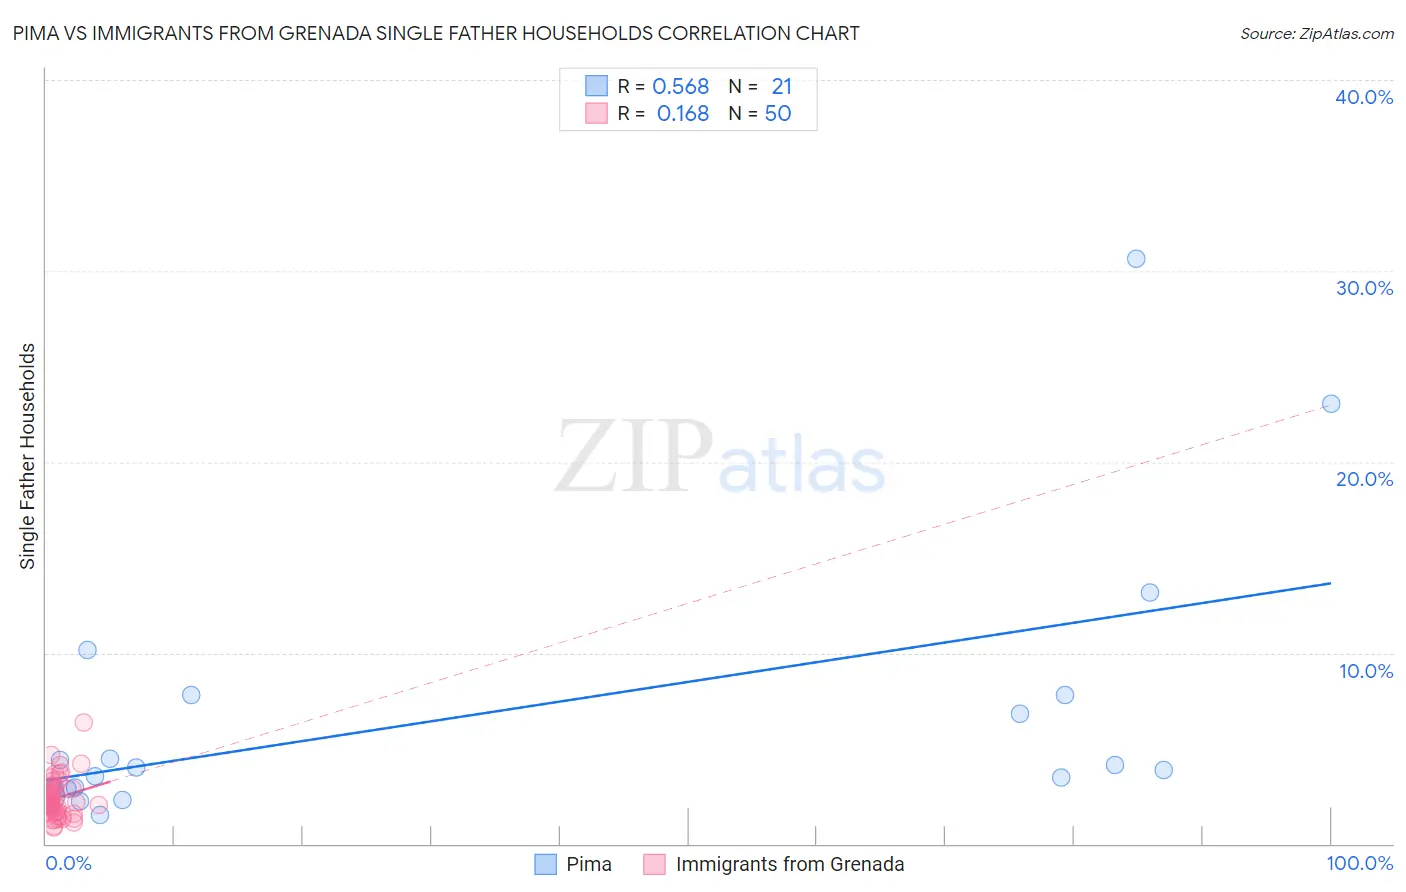
Pima vs Immigrants from Grenada Single Father Households Correlation Chart
The statistical analysis conducted on geographies consisting of 61,336,251 people shows a substantial positive correlation between the proportion of Pima and percentage of single father households in the United States with a correlation coefficient (R) of 0.568 and weighted average of 4.2%. Similarly, the statistical analysis conducted on geographies consisting of 67,096,407 people shows a poor positive correlation between the proportion of Immigrants from Grenada and percentage of single father households in the United States with a correlation coefficient (R) of 0.168 and weighted average of 2.0%, a difference of 108.4%.
Single Father Households Correlation Summary
| Measurement | Pima | Immigrants from Grenada |
| Minimum | 1.5% | 0.86% |
| Maximum | 30.6% | 6.4% |
| Range | 29.1% | 5.5% |
| Mean | 6.9% | 2.4% |
| Median | 4.0% | 2.1% |
| Interquartile 25% (IQ1) | 2.9% | 1.6% |
| Interquartile 75% (IQ3) | 7.8% | 3.0% |
| Interquartile Range (IQR) | 4.9% | 1.3% |
| Standard Deviation (Sample) | 7.3% | 1.1% |
| Standard Deviation (Population) | 7.2% | 1.0% |
Similar Demographics by Single Father Households
Demographics Similar to Pima by Single Father Households
In terms of single father households, the demographic groups most similar to Pima are Yakama (4.2%, a difference of 0.24%), Menominee (4.2%, a difference of 0.93%), Tohono O'odham (3.8%, a difference of 9.2%), Inupiat (4.9%, a difference of 16.4%), and Crow (3.5%, a difference of 18.8%).
| Demographics | Rating | Rank | Single Father Households |
| Natives/Alaskans | 0.0 /100 | #333 | Tragic 3.2% |
| Yuman | 0.0 /100 | #334 | Tragic 3.3% |
| Colville | 0.0 /100 | #335 | Tragic 3.3% |
| Paiute | 0.0 /100 | #336 | Tragic 3.3% |
| Pueblo | 0.0 /100 | #337 | Tragic 3.3% |
| Sioux | 0.0 /100 | #338 | Tragic 3.3% |
| Alaskan Athabascans | 0.0 /100 | #339 | Tragic 3.4% |
| Alaska Natives | 0.0 /100 | #340 | Tragic 3.5% |
| Crow | 0.0 /100 | #341 | Tragic 3.5% |
| Tohono O'odham | 0.0 /100 | #342 | Tragic 3.8% |
| Pima | 0.0 /100 | #343 | Tragic 4.2% |
| Yakama | 0.0 /100 | #344 | Tragic 4.2% |
| Menominee | 0.0 /100 | #345 | Tragic 4.2% |
| Inupiat | 0.0 /100 | #346 | Tragic 4.9% |
| Yup'ik | 0.0 /100 | #347 | Tragic 5.4% |
Demographics Similar to Immigrants from Grenada by Single Father Households
In terms of single father households, the demographic groups most similar to Immigrants from Grenada are Latvian (2.0%, a difference of 0.090%), Russian (2.0%, a difference of 0.10%), Immigrants from Lebanon (2.0%, a difference of 0.21%), Macedonian (2.0%, a difference of 0.23%), and Immigrants from Turkey (2.0%, a difference of 0.38%).
| Demographics | Rating | Rank | Single Father Households |
| Immigrants | Belgium | 100.0 /100 | #36 | Exceptional 2.0% |
| Immigrants | St. Vincent and the Grenadines | 100.0 /100 | #37 | Exceptional 2.0% |
| Immigrants | Eastern Europe | 100.0 /100 | #38 | Exceptional 2.0% |
| Immigrants | Sri Lanka | 100.0 /100 | #39 | Exceptional 2.0% |
| Immigrants | Bulgaria | 100.0 /100 | #40 | Exceptional 2.0% |
| Immigrants | Turkey | 100.0 /100 | #41 | Exceptional 2.0% |
| Macedonians | 100.0 /100 | #42 | Exceptional 2.0% |
| Immigrants | Grenada | 100.0 /100 | #43 | Exceptional 2.0% |
| Latvians | 100.0 /100 | #44 | Exceptional 2.0% |
| Russians | 100.0 /100 | #45 | Exceptional 2.0% |
| Immigrants | Lebanon | 100.0 /100 | #46 | Exceptional 2.0% |
| Immigrants | Ukraine | 99.9 /100 | #47 | Exceptional 2.0% |
| Immigrants | Kazakhstan | 99.9 /100 | #48 | Exceptional 2.0% |
| Immigrants | Serbia | 99.9 /100 | #49 | Exceptional 2.0% |
| Immigrants | Switzerland | 99.9 /100 | #50 | Exceptional 2.0% |