Peruvian vs Bolivian Births to Unmarried Women
COMPARE
Peruvian
Bolivian
Births to Unmarried Women
Births to Unmarried Women Comparison
Peruvians
Bolivians
31.5%
BIRTHS TO UNMARRIED WOMEN
55.5/ 100
METRIC RATING
166th/ 347
METRIC RANK
28.5%
BIRTHS TO UNMARRIED WOMEN
98.7/ 100
METRIC RATING
69th/ 347
METRIC RANK
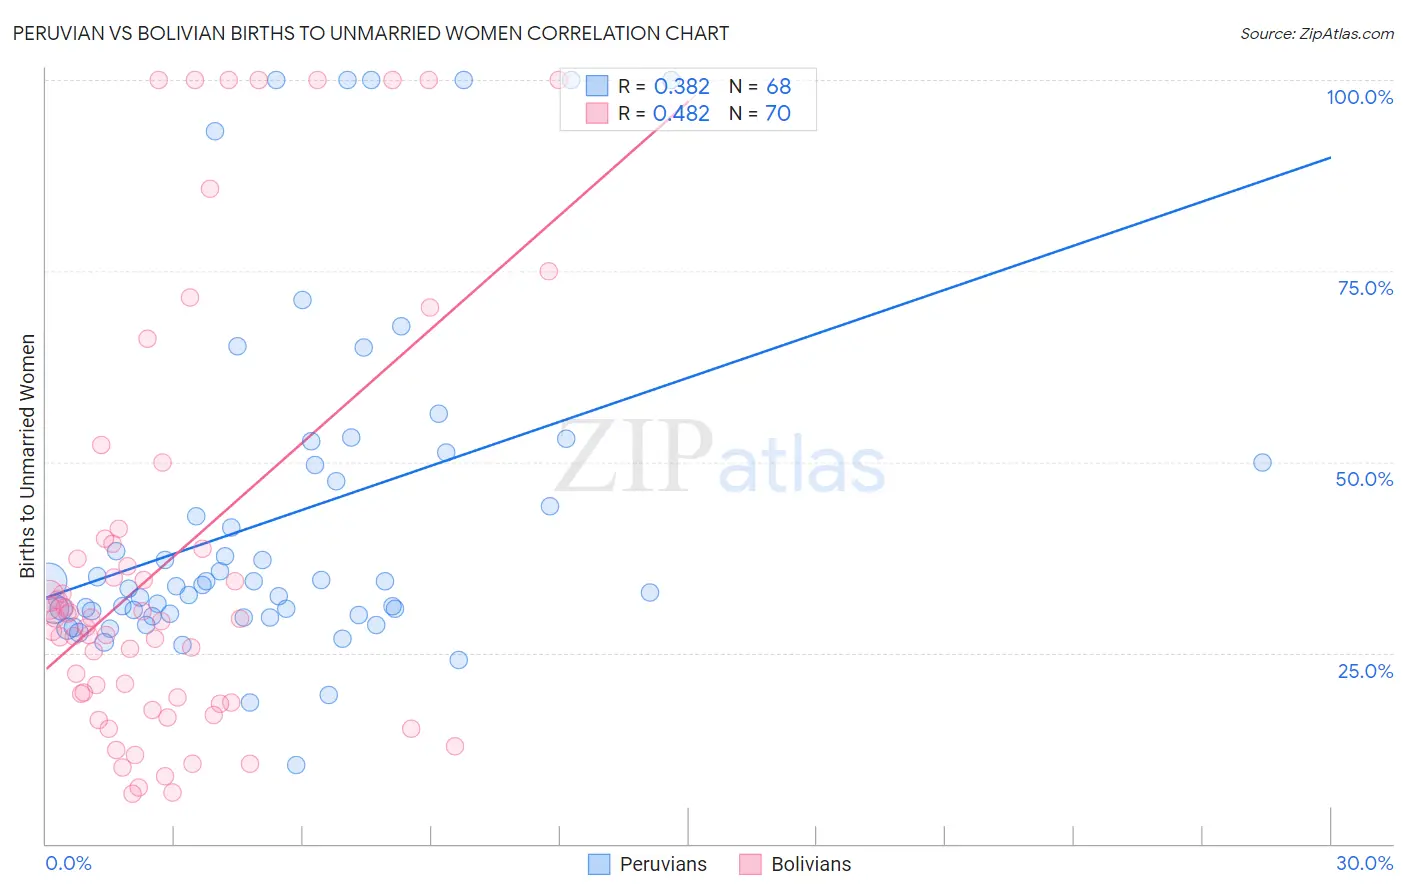
Peruvian vs Bolivian Births to Unmarried Women Correlation Chart
The statistical analysis conducted on geographies consisting of 342,193,604 people shows a mild positive correlation between the proportion of Peruvians and percentage of births to unmarried women in the United States with a correlation coefficient (R) of 0.382 and weighted average of 31.5%. Similarly, the statistical analysis conducted on geographies consisting of 177,966,984 people shows a moderate positive correlation between the proportion of Bolivians and percentage of births to unmarried women in the United States with a correlation coefficient (R) of 0.482 and weighted average of 28.5%, a difference of 10.7%.
Births to Unmarried Women Correlation Summary
| Measurement | Peruvian | Bolivian |
| Minimum | 10.2% | 6.5% |
| Maximum | 100.0% | 100.0% |
| Range | 89.8% | 93.5% |
| Mean | 42.7% | 37.1% |
| Median | 33.7% | 29.4% |
| Interquartile 25% (IQ1) | 30.1% | 18.5% |
| Interquartile 75% (IQ3) | 49.8% | 39.3% |
| Interquartile Range (IQR) | 19.7% | 20.8% |
| Standard Deviation (Sample) | 22.3% | 27.8% |
| Standard Deviation (Population) | 22.2% | 27.6% |
Similar Demographics by Births to Unmarried Women
Demographics Similar to Peruvians by Births to Unmarried Women
In terms of births to unmarried women, the demographic groups most similar to Peruvians are Dutch (31.5%, a difference of 0.030%), Immigrants from Somalia (31.4%, a difference of 0.25%), Belgian (31.6%, a difference of 0.30%), Slavic (31.6%, a difference of 0.34%), and Guamanian/Chamorro (31.6%, a difference of 0.40%).
| Demographics | Rating | Rank | Births to Unmarried Women |
| Immigrants | England | 69.4 /100 | #159 | Good 31.1% |
| Immigrants | Western Europe | 69.3 /100 | #160 | Good 31.1% |
| Immigrants | Southern Europe | 68.7 /100 | #161 | Good 31.1% |
| Slovenes | 65.9 /100 | #162 | Good 31.2% |
| Immigrants | Chile | 65.7 /100 | #163 | Good 31.2% |
| Hungarians | 64.1 /100 | #164 | Good 31.2% |
| Immigrants | Somalia | 58.1 /100 | #165 | Average 31.4% |
| Peruvians | 55.5 /100 | #166 | Average 31.5% |
| Dutch | 55.3 /100 | #167 | Average 31.5% |
| Belgians | 52.4 /100 | #168 | Average 31.6% |
| Slavs | 52.0 /100 | #169 | Average 31.6% |
| Guamanians/Chamorros | 51.3 /100 | #170 | Average 31.6% |
| Finns | 50.5 /100 | #171 | Average 31.7% |
| Immigrants | Eritrea | 50.4 /100 | #172 | Average 31.7% |
| Immigrants | Yemen | 50.2 /100 | #173 | Average 31.7% |
Demographics Similar to Bolivians by Births to Unmarried Women
In terms of births to unmarried women, the demographic groups most similar to Bolivians are Immigrants from Europe (28.4%, a difference of 0.040%), Laotian (28.5%, a difference of 0.060%), Palestinian (28.4%, a difference of 0.090%), Immigrants from Egypt (28.4%, a difference of 0.20%), and Immigrants from Czechoslovakia (28.4%, a difference of 0.22%).
| Demographics | Rating | Rank | Births to Unmarried Women |
| Egyptians | 99.0 /100 | #62 | Exceptional 28.2% |
| Immigrants | Serbia | 98.9 /100 | #63 | Exceptional 28.3% |
| Tongans | 98.8 /100 | #64 | Exceptional 28.4% |
| Immigrants | Czechoslovakia | 98.8 /100 | #65 | Exceptional 28.4% |
| Immigrants | Egypt | 98.8 /100 | #66 | Exceptional 28.4% |
| Palestinians | 98.7 /100 | #67 | Exceptional 28.4% |
| Immigrants | Europe | 98.7 /100 | #68 | Exceptional 28.4% |
| Bolivians | 98.7 /100 | #69 | Exceptional 28.5% |
| Laotians | 98.6 /100 | #70 | Exceptional 28.5% |
| Jordanians | 98.5 /100 | #71 | Exceptional 28.5% |
| Immigrants | Sweden | 98.5 /100 | #72 | Exceptional 28.5% |
| Albanians | 98.5 /100 | #73 | Exceptional 28.5% |
| Immigrants | Bolivia | 98.5 /100 | #74 | Exceptional 28.6% |
| Immigrants | Switzerland | 98.4 /100 | #75 | Exceptional 28.6% |
| Israelis | 98.4 /100 | #76 | Exceptional 28.6% |