Peruvian vs Immigrants from Western Asia Child Poverty Under the Age of 5
COMPARE
Peruvian
Immigrants from Western Asia
Child Poverty Under the Age of 5
Child Poverty Under the Age of 5 Comparison
Peruvians
Immigrants from Western Asia
16.0%
CHILD POVERTY UNDER THE AGE OF 5
94.1/ 100
METRIC RATING
112th/ 347
METRIC RANK
17.1%
CHILD POVERTY UNDER THE AGE OF 5
59.2/ 100
METRIC RATING
170th/ 347
METRIC RANK
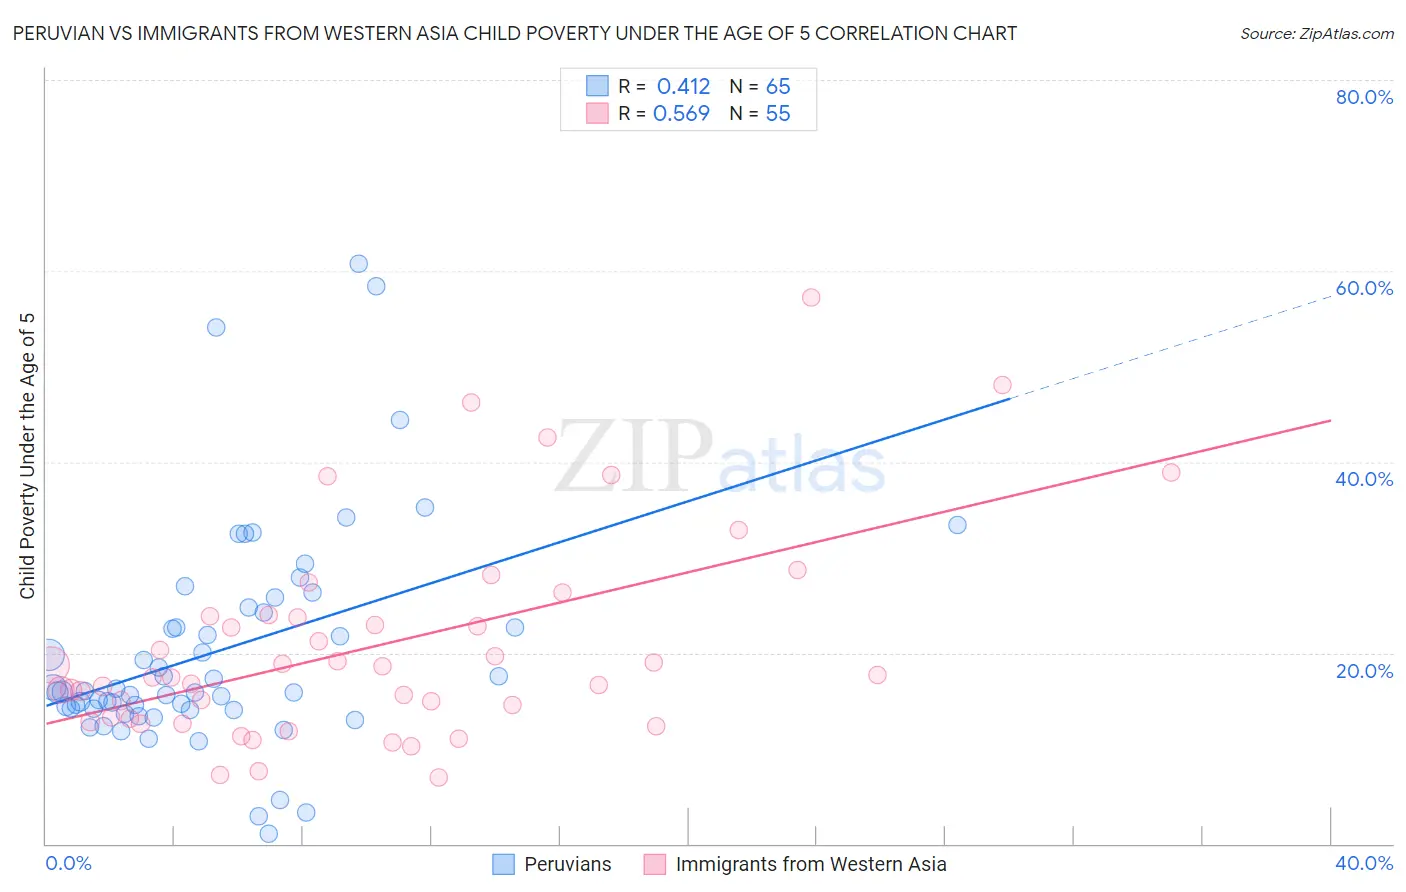
Peruvian vs Immigrants from Western Asia Child Poverty Under the Age of 5 Correlation Chart
The statistical analysis conducted on geographies consisting of 350,289,776 people shows a moderate positive correlation between the proportion of Peruvians and poverty level among children under the age of 5 in the United States with a correlation coefficient (R) of 0.412 and weighted average of 16.0%. Similarly, the statistical analysis conducted on geographies consisting of 385,967,635 people shows a substantial positive correlation between the proportion of Immigrants from Western Asia and poverty level among children under the age of 5 in the United States with a correlation coefficient (R) of 0.569 and weighted average of 17.1%, a difference of 6.7%.
Child Poverty Under the Age of 5 Correlation Summary
| Measurement | Peruvian | Immigrants from Western Asia |
| Minimum | 1.0% | 7.0% |
| Maximum | 60.7% | 57.2% |
| Range | 59.7% | 50.3% |
| Mean | 20.2% | 20.7% |
| Median | 15.9% | 17.4% |
| Interquartile 25% (IQ1) | 14.1% | 13.2% |
| Interquartile 75% (IQ3) | 24.4% | 23.9% |
| Interquartile Range (IQR) | 10.3% | 10.7% |
| Standard Deviation (Sample) | 11.6% | 10.9% |
| Standard Deviation (Population) | 11.5% | 10.8% |
Similar Demographics by Child Poverty Under the Age of 5
Demographics Similar to Peruvians by Child Poverty Under the Age of 5
In terms of child poverty under the age of 5, the demographic groups most similar to Peruvians are Puget Sound Salish (16.0%, a difference of 0.010%), Pakistani (16.0%, a difference of 0.050%), Romanian (16.0%, a difference of 0.090%), Immigrants from Kuwait (16.0%, a difference of 0.090%), and Northern European (16.0%, a difference of 0.10%).
| Demographics | Rating | Rank | Child Poverty Under the Age of 5 |
| Immigrants | Spain | 94.8 /100 | #105 | Exceptional 15.9% |
| Tlingit-Haida | 94.7 /100 | #106 | Exceptional 15.9% |
| Slovenes | 94.4 /100 | #107 | Exceptional 16.0% |
| Immigrants | Brazil | 94.4 /100 | #108 | Exceptional 16.0% |
| Northern Europeans | 94.3 /100 | #109 | Exceptional 16.0% |
| Romanians | 94.3 /100 | #110 | Exceptional 16.0% |
| Pakistanis | 94.2 /100 | #111 | Exceptional 16.0% |
| Peruvians | 94.1 /100 | #112 | Exceptional 16.0% |
| Puget Sound Salish | 94.1 /100 | #113 | Exceptional 16.0% |
| Immigrants | Kuwait | 93.9 /100 | #114 | Exceptional 16.0% |
| Albanians | 93.8 /100 | #115 | Exceptional 16.0% |
| Immigrants | Austria | 93.5 /100 | #116 | Exceptional 16.0% |
| Basques | 93.4 /100 | #117 | Exceptional 16.0% |
| Immigrants | Denmark | 93.4 /100 | #118 | Exceptional 16.0% |
| Immigrants | Jordan | 93.2 /100 | #119 | Exceptional 16.1% |
Demographics Similar to Immigrants from Western Asia by Child Poverty Under the Age of 5
In terms of child poverty under the age of 5, the demographic groups most similar to Immigrants from Western Asia are Immigrants from Morocco (17.1%, a difference of 0.030%), Immigrants from South America (17.1%, a difference of 0.090%), Uruguayan (17.0%, a difference of 0.14%), Immigrants from Uzbekistan (17.0%, a difference of 0.30%), and Slavic (17.0%, a difference of 0.53%).
| Demographics | Rating | Rank | Child Poverty Under the Age of 5 |
| Scottish | 68.6 /100 | #163 | Good 16.9% |
| Immigrants | Oceania | 67.6 /100 | #164 | Good 16.9% |
| Immigrants | Colombia | 66.9 /100 | #165 | Good 16.9% |
| Slavs | 64.0 /100 | #166 | Good 17.0% |
| Immigrants | Uzbekistan | 62.0 /100 | #167 | Good 17.0% |
| Uruguayans | 60.5 /100 | #168 | Good 17.0% |
| Immigrants | South America | 60.0 /100 | #169 | Good 17.1% |
| Immigrants | Western Asia | 59.2 /100 | #170 | Average 17.1% |
| Immigrants | Morocco | 58.9 /100 | #171 | Average 17.1% |
| Yugoslavians | 54.1 /100 | #172 | Average 17.2% |
| Welsh | 54.0 /100 | #173 | Average 17.2% |
| Immigrants | Saudi Arabia | 50.0 /100 | #174 | Average 17.2% |
| Immigrants | Lebanon | 47.6 /100 | #175 | Average 17.3% |
| Immigrants | Iraq | 45.2 /100 | #176 | Average 17.3% |
| Immigrants | Sierra Leone | 43.6 /100 | #177 | Average 17.3% |