Cree vs Greek Single Mother Households
COMPARE
Cree
Greek
Single Mother Households
Single Mother Households Comparison
Cree
Greeks
6.7%
SINGLE MOTHER HOUSEHOLDS
11.9/ 100
METRIC RATING
205th/ 347
METRIC RANK
5.6%
SINGLE MOTHER HOUSEHOLDS
98.6/ 100
METRIC RATING
65th/ 347
METRIC RANK
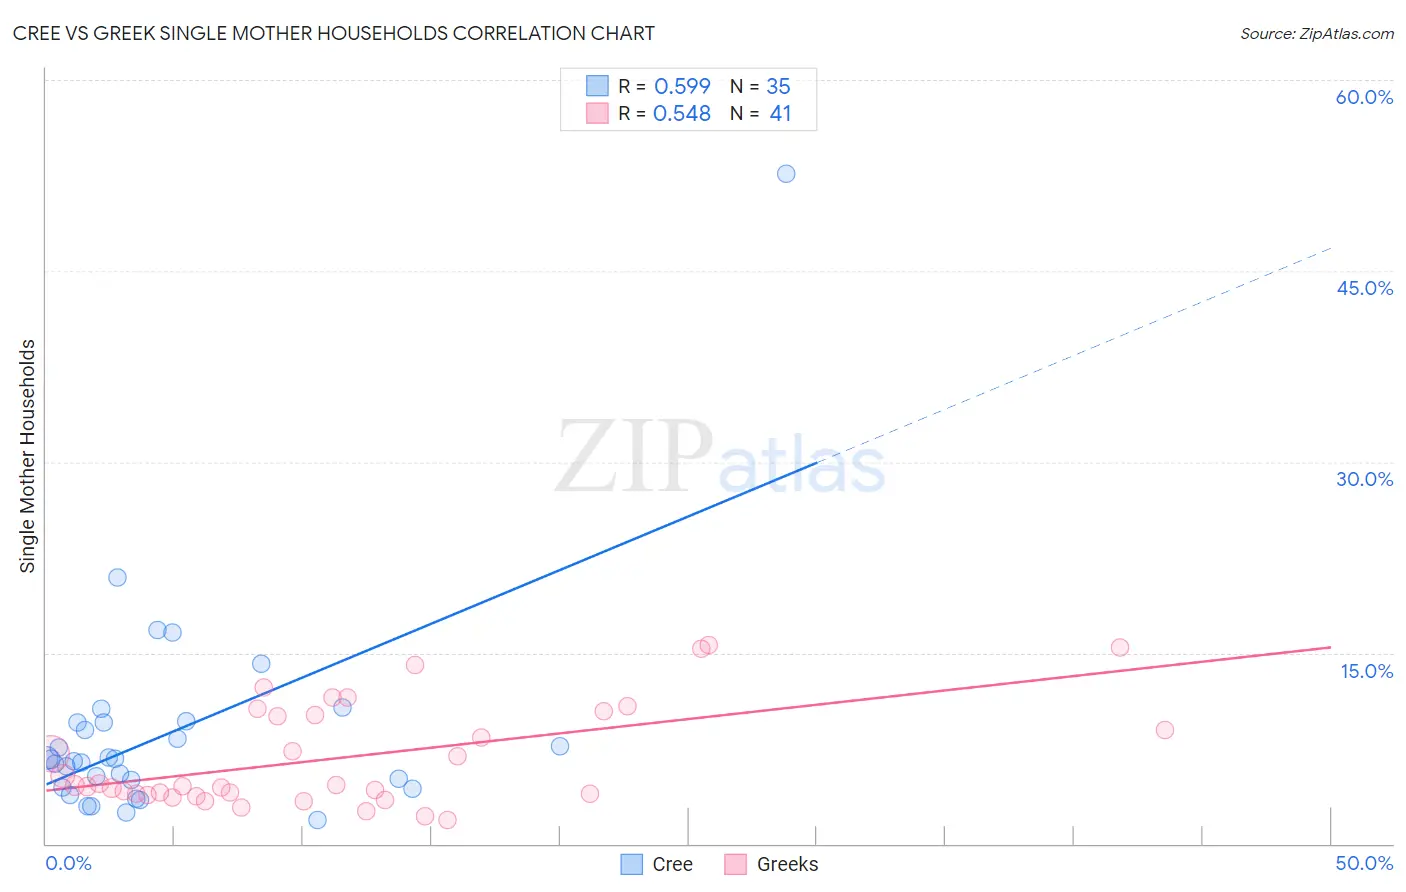
Cree vs Greek Single Mother Households Correlation Chart
The statistical analysis conducted on geographies consisting of 76,173,088 people shows a substantial positive correlation between the proportion of Cree and percentage of single mother households in the United States with a correlation coefficient (R) of 0.599 and weighted average of 6.7%. Similarly, the statistical analysis conducted on geographies consisting of 480,310,145 people shows a substantial positive correlation between the proportion of Greeks and percentage of single mother households in the United States with a correlation coefficient (R) of 0.548 and weighted average of 5.6%, a difference of 19.3%.
Single Mother Households Correlation Summary
| Measurement | Cree | Greek |
| Minimum | 1.9% | 1.8% |
| Maximum | 52.6% | 15.6% |
| Range | 50.8% | 13.8% |
| Mean | 8.7% | 6.8% |
| Median | 6.6% | 4.6% |
| Interquartile 25% (IQ1) | 4.4% | 3.9% |
| Interquartile 75% (IQ3) | 9.5% | 10.3% |
| Interquartile Range (IQR) | 5.1% | 6.4% |
| Standard Deviation (Sample) | 8.7% | 4.0% |
| Standard Deviation (Population) | 8.6% | 4.0% |
Similar Demographics by Single Mother Households
Demographics Similar to Cree by Single Mother Households
In terms of single mother households, the demographic groups most similar to Cree are Immigrants from Fiji (6.7%, a difference of 0.020%), Immigrants from Peru (6.7%, a difference of 0.030%), German Russian (6.7%, a difference of 0.080%), Immigrants from South America (6.7%, a difference of 0.080%), and Guamanian/Chamorro (6.6%, a difference of 0.13%).
| Demographics | Rating | Rank | Single Mother Households |
| Hawaiians | 16.1 /100 | #198 | Poor 6.6% |
| Potawatomi | 15.5 /100 | #199 | Poor 6.6% |
| Immigrants | Ethiopia | 14.7 /100 | #200 | Poor 6.6% |
| Venezuelans | 12.9 /100 | #201 | Poor 6.6% |
| Guamanians/Chamorros | 12.4 /100 | #202 | Poor 6.6% |
| Immigrants | Peru | 12.0 /100 | #203 | Poor 6.7% |
| Immigrants | Fiji | 11.9 /100 | #204 | Poor 6.7% |
| Cree | 11.9 /100 | #205 | Poor 6.7% |
| German Russians | 11.5 /100 | #206 | Poor 6.7% |
| Immigrants | South America | 11.5 /100 | #207 | Poor 6.7% |
| Vietnamese | 11.3 /100 | #208 | Poor 6.7% |
| Immigrants | Colombia | 10.5 /100 | #209 | Poor 6.7% |
| Immigrants | Nonimmigrants | 10.4 /100 | #210 | Poor 6.7% |
| Immigrants | Venezuela | 8.5 /100 | #211 | Tragic 6.7% |
| Immigrants | Eritrea | 8.4 /100 | #212 | Tragic 6.7% |
Demographics Similar to Greeks by Single Mother Households
In terms of single mother households, the demographic groups most similar to Greeks are Immigrants from France (5.6%, a difference of 0.040%), Immigrants from North Macedonia (5.6%, a difference of 0.080%), Immigrants from Canada (5.6%, a difference of 0.10%), Italian (5.6%, a difference of 0.12%), and Polish (5.6%, a difference of 0.15%).
| Demographics | Rating | Rank | Single Mother Households |
| Danes | 98.9 /100 | #58 | Exceptional 5.5% |
| Luxembourgers | 98.7 /100 | #59 | Exceptional 5.6% |
| Immigrants | Norway | 98.7 /100 | #60 | Exceptional 5.6% |
| Australians | 98.7 /100 | #61 | Exceptional 5.6% |
| Poles | 98.6 /100 | #62 | Exceptional 5.6% |
| Immigrants | North Macedonia | 98.6 /100 | #63 | Exceptional 5.6% |
| Immigrants | France | 98.6 /100 | #64 | Exceptional 5.6% |
| Greeks | 98.6 /100 | #65 | Exceptional 5.6% |
| Immigrants | Canada | 98.5 /100 | #66 | Exceptional 5.6% |
| Italians | 98.5 /100 | #67 | Exceptional 5.6% |
| Immigrants | Bulgaria | 98.5 /100 | #68 | Exceptional 5.6% |
| Asians | 98.5 /100 | #69 | Exceptional 5.6% |
| Immigrants | Eastern Europe | 98.4 /100 | #70 | Exceptional 5.6% |
| Immigrants | Kazakhstan | 98.4 /100 | #71 | Exceptional 5.6% |
| Immigrants | Netherlands | 98.4 /100 | #72 | Exceptional 5.6% |