Immigrants from Ukraine vs Immigrants from Grenada Births to Unmarried Women
COMPARE
Immigrants from Ukraine
Immigrants from Grenada
Births to Unmarried Women
Births to Unmarried Women Comparison
Immigrants from Ukraine
Immigrants from Grenada
27.2%
BIRTHS TO UNMARRIED WOMEN
99.7/ 100
METRIC RATING
37th/ 347
METRIC RANK
36.3%
BIRTHS TO UNMARRIED WOMEN
0.2/ 100
METRIC RATING
257th/ 347
METRIC RANK
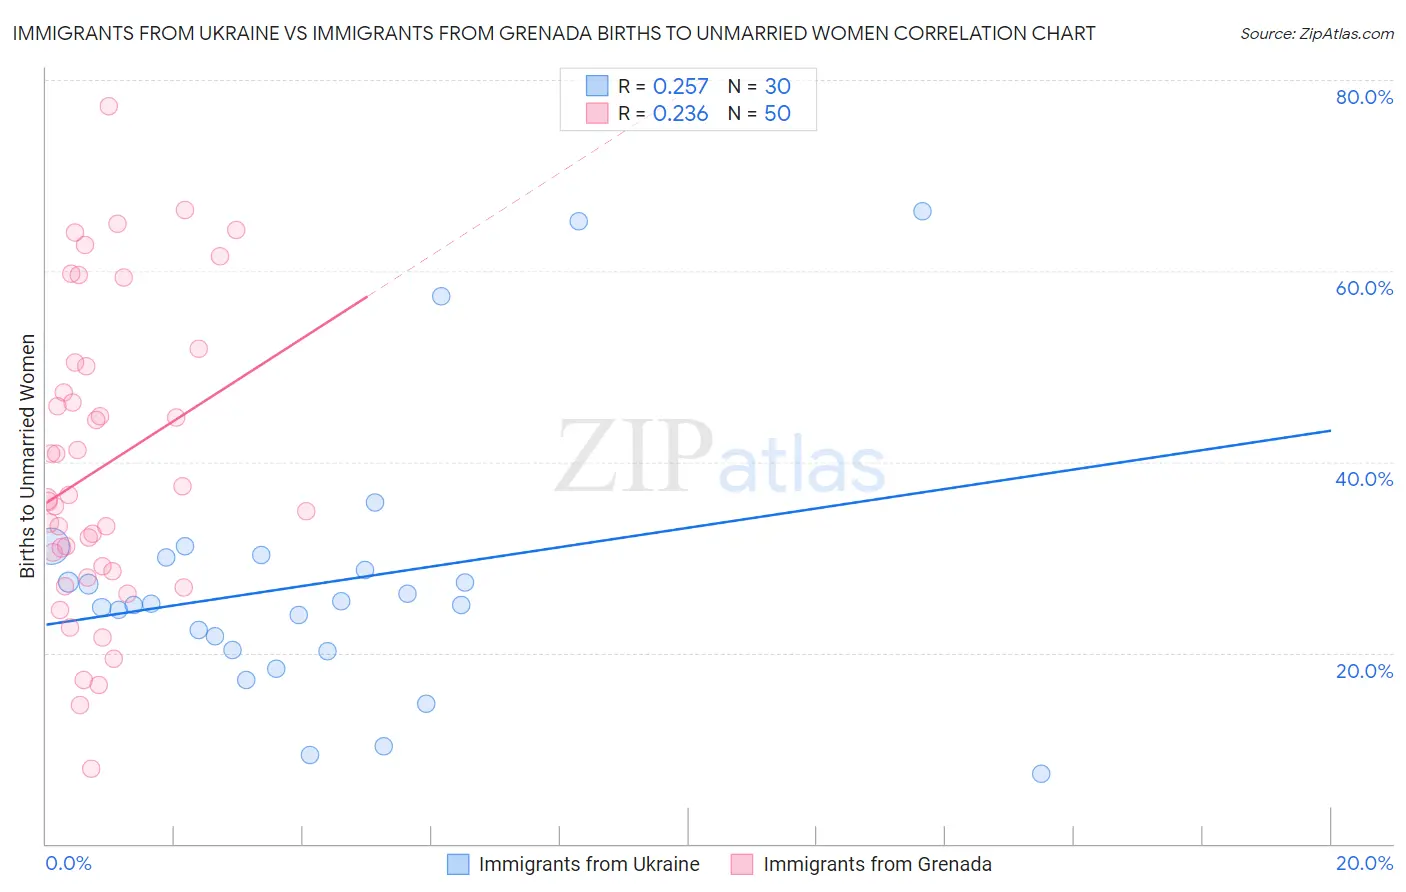
Immigrants from Ukraine vs Immigrants from Grenada Births to Unmarried Women Correlation Chart
The statistical analysis conducted on geographies consisting of 271,328,047 people shows a weak positive correlation between the proportion of Immigrants from Ukraine and percentage of births to unmarried women in the United States with a correlation coefficient (R) of 0.257 and weighted average of 27.2%. Similarly, the statistical analysis conducted on geographies consisting of 66,381,769 people shows a weak positive correlation between the proportion of Immigrants from Grenada and percentage of births to unmarried women in the United States with a correlation coefficient (R) of 0.236 and weighted average of 36.3%, a difference of 33.3%.
Births to Unmarried Women Correlation Summary
| Measurement | Immigrants from Ukraine | Immigrants from Grenada |
| Minimum | 7.4% | 7.9% |
| Maximum | 66.3% | 77.2% |
| Range | 58.9% | 69.3% |
| Mean | 27.3% | 39.4% |
| Median | 25.1% | 36.0% |
| Interquartile 25% (IQ1) | 20.3% | 28.6% |
| Interquartile 75% (IQ3) | 30.0% | 50.1% |
| Interquartile Range (IQR) | 9.7% | 21.5% |
| Standard Deviation (Sample) | 13.8% | 15.7% |
| Standard Deviation (Population) | 13.6% | 15.6% |
Similar Demographics by Births to Unmarried Women
Demographics Similar to Immigrants from Ukraine by Births to Unmarried Women
In terms of births to unmarried women, the demographic groups most similar to Immigrants from Ukraine are Immigrants from Western Asia (27.2%, a difference of 0.090%), Immigrants from Moldova (27.3%, a difference of 0.14%), Immigrants from Ireland (27.2%, a difference of 0.16%), Immigrants from Pakistan (27.2%, a difference of 0.23%), and Immigrants from Sri Lanka (27.2%, a difference of 0.28%).
| Demographics | Rating | Rank | Births to Unmarried Women |
| Bulgarians | 99.8 /100 | #30 | Exceptional 27.1% |
| Immigrants | Iraq | 99.8 /100 | #31 | Exceptional 27.1% |
| Immigrants | Russia | 99.8 /100 | #32 | Exceptional 27.1% |
| Immigrants | Sri Lanka | 99.8 /100 | #33 | Exceptional 27.2% |
| Immigrants | Pakistan | 99.8 /100 | #34 | Exceptional 27.2% |
| Immigrants | Ireland | 99.7 /100 | #35 | Exceptional 27.2% |
| Immigrants | Western Asia | 99.7 /100 | #36 | Exceptional 27.2% |
| Immigrants | Ukraine | 99.7 /100 | #37 | Exceptional 27.2% |
| Immigrants | Moldova | 99.7 /100 | #38 | Exceptional 27.3% |
| Immigrants | Malaysia | 99.7 /100 | #39 | Exceptional 27.4% |
| Turks | 99.6 /100 | #40 | Exceptional 27.4% |
| Iraqis | 99.6 /100 | #41 | Exceptional 27.6% |
| Immigrants | Eastern Europe | 99.6 /100 | #42 | Exceptional 27.6% |
| Immigrants | Bulgaria | 99.6 /100 | #43 | Exceptional 27.6% |
| Immigrants | Indonesia | 99.5 /100 | #44 | Exceptional 27.7% |
Demographics Similar to Immigrants from Grenada by Births to Unmarried Women
In terms of births to unmarried women, the demographic groups most similar to Immigrants from Grenada are Chickasaw (36.3%, a difference of 0.030%), Immigrants from Trinidad and Tobago (36.3%, a difference of 0.030%), Potawatomi (36.2%, a difference of 0.16%), American (36.4%, a difference of 0.28%), and Immigrants from El Salvador (36.4%, a difference of 0.33%).
| Demographics | Rating | Rank | Births to Unmarried Women |
| Mexican American Indians | 0.4 /100 | #250 | Tragic 35.7% |
| Immigrants | Western Africa | 0.3 /100 | #251 | Tragic 36.0% |
| Salvadorans | 0.3 /100 | #252 | Tragic 36.0% |
| Immigrants | Portugal | 0.2 /100 | #253 | Tragic 36.2% |
| Potawatomi | 0.2 /100 | #254 | Tragic 36.2% |
| Chickasaw | 0.2 /100 | #255 | Tragic 36.3% |
| Immigrants | Trinidad and Tobago | 0.2 /100 | #256 | Tragic 36.3% |
| Immigrants | Grenada | 0.2 /100 | #257 | Tragic 36.3% |
| Americans | 0.2 /100 | #258 | Tragic 36.4% |
| Immigrants | El Salvador | 0.2 /100 | #259 | Tragic 36.4% |
| Ottawa | 0.2 /100 | #260 | Tragic 36.5% |
| Trinidadians and Tobagonians | 0.2 /100 | #261 | Tragic 36.5% |
| French American Indians | 0.1 /100 | #262 | Tragic 36.6% |
| Nicaraguans | 0.1 /100 | #263 | Tragic 36.6% |
| Sub-Saharan Africans | 0.1 /100 | #264 | Tragic 36.7% |