Immigrants from Vietnam vs Immigrants from Grenada Births to Unmarried Women
COMPARE
Immigrants from Vietnam
Immigrants from Grenada
Births to Unmarried Women
Births to Unmarried Women Comparison
Immigrants from Vietnam
Immigrants from Grenada
29.3%
BIRTHS TO UNMARRIED WOMEN
96.1/ 100
METRIC RATING
95th/ 347
METRIC RANK
36.3%
BIRTHS TO UNMARRIED WOMEN
0.2/ 100
METRIC RATING
257th/ 347
METRIC RANK
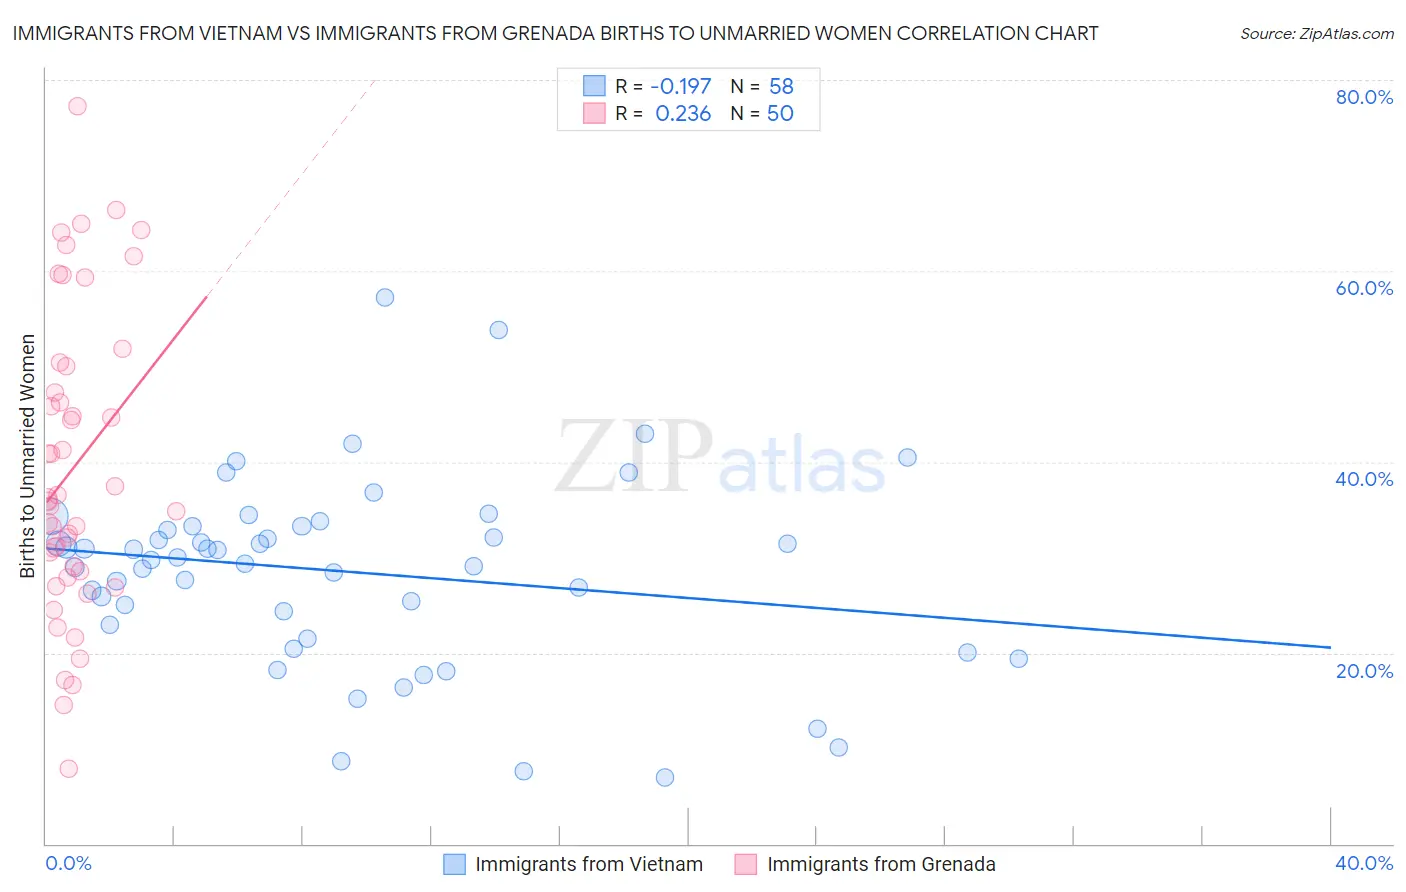
Immigrants from Vietnam vs Immigrants from Grenada Births to Unmarried Women Correlation Chart
The statistical analysis conducted on geographies consisting of 380,517,286 people shows a poor negative correlation between the proportion of Immigrants from Vietnam and percentage of births to unmarried women in the United States with a correlation coefficient (R) of -0.197 and weighted average of 29.3%. Similarly, the statistical analysis conducted on geographies consisting of 66,381,769 people shows a weak positive correlation between the proportion of Immigrants from Grenada and percentage of births to unmarried women in the United States with a correlation coefficient (R) of 0.236 and weighted average of 36.3%, a difference of 24.0%.
Births to Unmarried Women Correlation Summary
| Measurement | Immigrants from Vietnam | Immigrants from Grenada |
| Minimum | 6.9% | 7.9% |
| Maximum | 57.3% | 77.2% |
| Range | 50.4% | 69.3% |
| Mean | 28.5% | 39.4% |
| Median | 29.9% | 36.0% |
| Interquartile 25% (IQ1) | 22.9% | 28.6% |
| Interquartile 75% (IQ3) | 33.2% | 50.1% |
| Interquartile Range (IQR) | 10.3% | 21.5% |
| Standard Deviation (Sample) | 9.9% | 15.7% |
| Standard Deviation (Population) | 9.9% | 15.6% |
Similar Demographics by Births to Unmarried Women
Demographics Similar to Immigrants from Vietnam by Births to Unmarried Women
In terms of births to unmarried women, the demographic groups most similar to Immigrants from Vietnam are Ukrainian (29.2%, a difference of 0.13%), Norwegian (29.3%, a difference of 0.23%), Estonian (29.2%, a difference of 0.26%), Immigrants from South Africa (29.3%, a difference of 0.27%), and Arab (29.2%, a difference of 0.30%).
| Demographics | Rating | Rank | Births to Unmarried Women |
| Immigrants | France | 97.3 /100 | #88 | Exceptional 29.0% |
| Immigrants | Saudi Arabia | 97.0 /100 | #89 | Exceptional 29.1% |
| Immigrants | Latvia | 96.8 /100 | #90 | Exceptional 29.1% |
| Immigrants | Fiji | 96.6 /100 | #91 | Exceptional 29.2% |
| Arabs | 96.5 /100 | #92 | Exceptional 29.2% |
| Estonians | 96.5 /100 | #93 | Exceptional 29.2% |
| Ukrainians | 96.3 /100 | #94 | Exceptional 29.2% |
| Immigrants | Vietnam | 96.1 /100 | #95 | Exceptional 29.3% |
| Norwegians | 95.8 /100 | #96 | Exceptional 29.3% |
| Immigrants | South Africa | 95.7 /100 | #97 | Exceptional 29.3% |
| Immigrants | Syria | 95.7 /100 | #98 | Exceptional 29.4% |
| Immigrants | Denmark | 95.3 /100 | #99 | Exceptional 29.4% |
| Luxembourgers | 95.2 /100 | #100 | Exceptional 29.4% |
| Immigrants | Northern Africa | 94.7 /100 | #101 | Exceptional 29.5% |
| Australians | 94.6 /100 | #102 | Exceptional 29.5% |
Demographics Similar to Immigrants from Grenada by Births to Unmarried Women
In terms of births to unmarried women, the demographic groups most similar to Immigrants from Grenada are Chickasaw (36.3%, a difference of 0.030%), Immigrants from Trinidad and Tobago (36.3%, a difference of 0.030%), Potawatomi (36.2%, a difference of 0.16%), American (36.4%, a difference of 0.28%), and Immigrants from El Salvador (36.4%, a difference of 0.33%).
| Demographics | Rating | Rank | Births to Unmarried Women |
| Mexican American Indians | 0.4 /100 | #250 | Tragic 35.7% |
| Immigrants | Western Africa | 0.3 /100 | #251 | Tragic 36.0% |
| Salvadorans | 0.3 /100 | #252 | Tragic 36.0% |
| Immigrants | Portugal | 0.2 /100 | #253 | Tragic 36.2% |
| Potawatomi | 0.2 /100 | #254 | Tragic 36.2% |
| Chickasaw | 0.2 /100 | #255 | Tragic 36.3% |
| Immigrants | Trinidad and Tobago | 0.2 /100 | #256 | Tragic 36.3% |
| Immigrants | Grenada | 0.2 /100 | #257 | Tragic 36.3% |
| Americans | 0.2 /100 | #258 | Tragic 36.4% |
| Immigrants | El Salvador | 0.2 /100 | #259 | Tragic 36.4% |
| Ottawa | 0.2 /100 | #260 | Tragic 36.5% |
| Trinidadians and Tobagonians | 0.2 /100 | #261 | Tragic 36.5% |
| French American Indians | 0.1 /100 | #262 | Tragic 36.6% |
| Nicaraguans | 0.1 /100 | #263 | Tragic 36.6% |
| Sub-Saharan Africans | 0.1 /100 | #264 | Tragic 36.7% |