Immigrants from Northern Africa vs Immigrants from Pakistan Divorced or Separated
COMPARE
Immigrants from Northern Africa
Immigrants from Pakistan
Divorced or Separated
Divorced or Separated Comparison
Immigrants from Northern Africa
Immigrants from Pakistan
11.5%
DIVORCED OR SEPARATED
99.6/ 100
METRIC RATING
75th/ 347
METRIC RANK
10.8%
DIVORCED OR SEPARATED
100.0/ 100
METRIC RATING
23rd/ 347
METRIC RANK
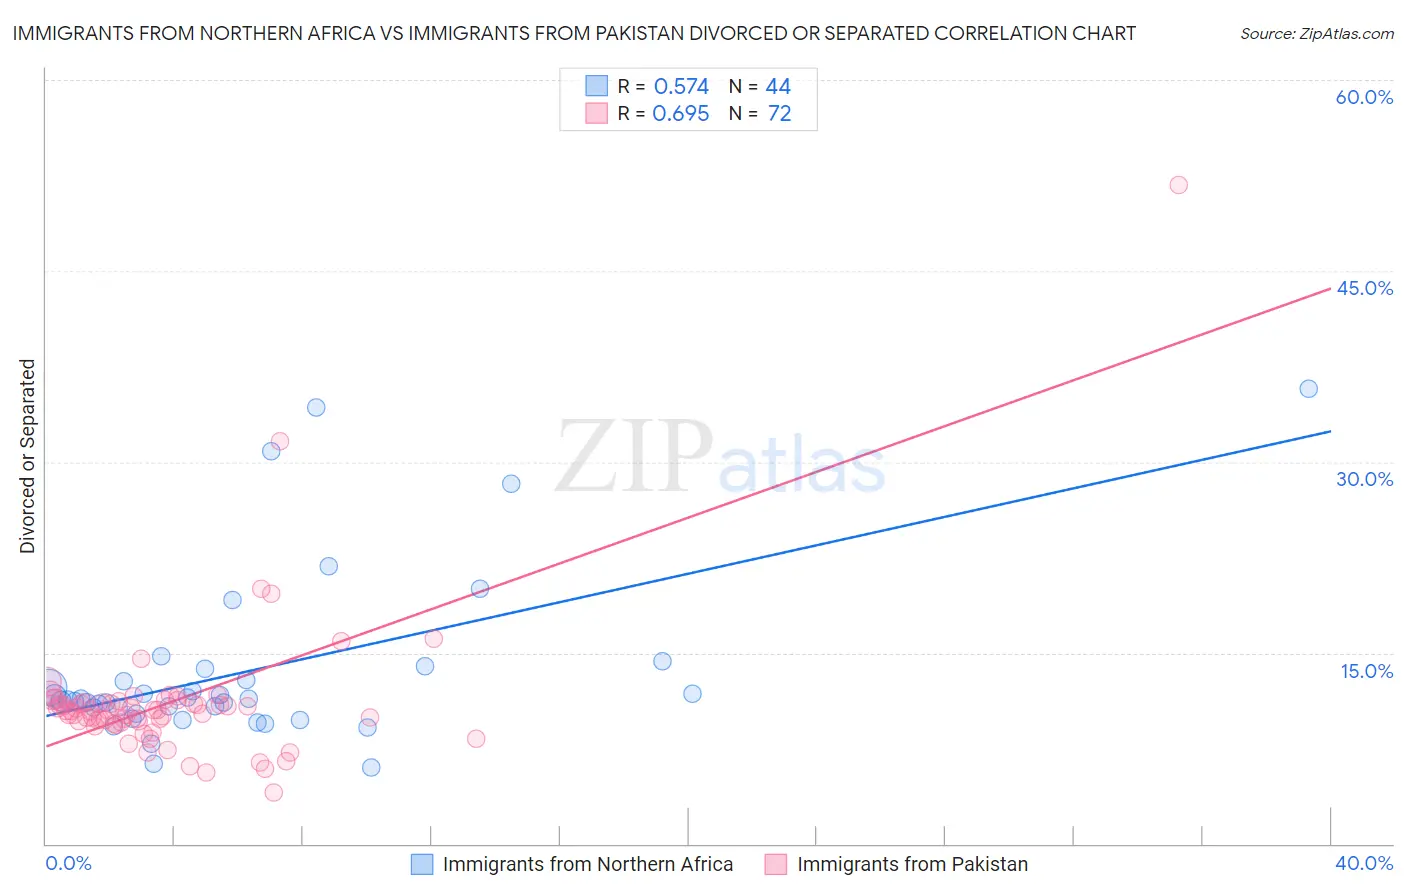
Immigrants from Northern Africa vs Immigrants from Pakistan Divorced or Separated Correlation Chart
The statistical analysis conducted on geographies consisting of 321,125,060 people shows a substantial positive correlation between the proportion of Immigrants from Northern Africa and percentage of population currently divorced or separated in the United States with a correlation coefficient (R) of 0.574 and weighted average of 11.5%. Similarly, the statistical analysis conducted on geographies consisting of 283,830,422 people shows a significant positive correlation between the proportion of Immigrants from Pakistan and percentage of population currently divorced or separated in the United States with a correlation coefficient (R) of 0.695 and weighted average of 10.8%, a difference of 6.6%.
Divorced or Separated Correlation Summary
| Measurement | Immigrants from Northern Africa | Immigrants from Pakistan |
| Minimum | 6.0% | 4.0% |
| Maximum | 35.7% | 51.8% |
| Range | 29.7% | 47.8% |
| Mean | 13.5% | 11.2% |
| Median | 11.3% | 10.5% |
| Interquartile 25% (IQ1) | 10.5% | 9.6% |
| Interquartile 75% (IQ3) | 13.3% | 11.1% |
| Interquartile Range (IQR) | 2.8% | 1.6% |
| Standard Deviation (Sample) | 6.7% | 6.0% |
| Standard Deviation (Population) | 6.7% | 6.0% |
Similar Demographics by Divorced or Separated
Demographics Similar to Immigrants from Northern Africa by Divorced or Separated
In terms of divorced or separated, the demographic groups most similar to Immigrants from Northern Africa are Albanian (11.5%, a difference of 0.020%), Taiwanese (11.5%, a difference of 0.080%), Immigrants from Italy (11.5%, a difference of 0.13%), Jordanian (11.5%, a difference of 0.14%), and Immigrants from North Macedonia (11.5%, a difference of 0.14%).
| Demographics | Rating | Rank | Divorced or Separated |
| Palestinians | 99.7 /100 | #68 | Exceptional 11.5% |
| Immigrants | Belgium | 99.7 /100 | #69 | Exceptional 11.5% |
| Immigrants | Eastern Europe | 99.7 /100 | #70 | Exceptional 11.5% |
| Paraguayans | 99.7 /100 | #71 | Exceptional 11.5% |
| Jordanians | 99.6 /100 | #72 | Exceptional 11.5% |
| Immigrants | North Macedonia | 99.6 /100 | #73 | Exceptional 11.5% |
| Taiwanese | 99.6 /100 | #74 | Exceptional 11.5% |
| Immigrants | Northern Africa | 99.6 /100 | #75 | Exceptional 11.5% |
| Albanians | 99.6 /100 | #76 | Exceptional 11.5% |
| Immigrants | Italy | 99.5 /100 | #77 | Exceptional 11.5% |
| Afghans | 99.4 /100 | #78 | Exceptional 11.5% |
| Guyanese | 99.4 /100 | #79 | Exceptional 11.5% |
| Immigrants | Switzerland | 99.4 /100 | #80 | Exceptional 11.5% |
| Russians | 99.4 /100 | #81 | Exceptional 11.5% |
| Immigrants | Romania | 99.3 /100 | #82 | Exceptional 11.5% |
Demographics Similar to Immigrants from Pakistan by Divorced or Separated
In terms of divorced or separated, the demographic groups most similar to Immigrants from Pakistan are Vietnamese (10.8%, a difference of 0.18%), Immigrants from Sri Lanka (10.8%, a difference of 0.19%), Iranian (10.8%, a difference of 0.24%), Immigrants from Asia (10.7%, a difference of 0.43%), and Burmese (10.7%, a difference of 0.62%).
| Demographics | Rating | Rank | Divorced or Separated |
| Immigrants | Korea | 100.0 /100 | #16 | Exceptional 10.6% |
| Immigrants | Israel | 100.0 /100 | #17 | Exceptional 10.6% |
| Immigrants | Iran | 100.0 /100 | #18 | Exceptional 10.6% |
| Asians | 100.0 /100 | #19 | Exceptional 10.6% |
| Burmese | 100.0 /100 | #20 | Exceptional 10.7% |
| Immigrants | Asia | 100.0 /100 | #21 | Exceptional 10.7% |
| Vietnamese | 100.0 /100 | #22 | Exceptional 10.8% |
| Immigrants | Pakistan | 100.0 /100 | #23 | Exceptional 10.8% |
| Immigrants | Sri Lanka | 100.0 /100 | #24 | Exceptional 10.8% |
| Iranians | 100.0 /100 | #25 | Exceptional 10.8% |
| Immigrants | Indonesia | 100.0 /100 | #26 | Exceptional 10.9% |
| Immigrants | Bangladesh | 100.0 /100 | #27 | Exceptional 11.0% |
| Immigrants | Malaysia | 100.0 /100 | #28 | Exceptional 11.0% |
| Armenians | 100.0 /100 | #29 | Exceptional 11.0% |
| Immigrants | Ireland | 100.0 /100 | #30 | Exceptional 11.0% |