Australian vs Immigrants from Pakistan Divorced or Separated
COMPARE
Australian
Immigrants from Pakistan
Divorced or Separated
Divorced or Separated Comparison
Australians
Immigrants from Pakistan
11.9%
DIVORCED OR SEPARATED
83.6/ 100
METRIC RATING
139th/ 347
METRIC RANK
10.8%
DIVORCED OR SEPARATED
100.0/ 100
METRIC RATING
23rd/ 347
METRIC RANK
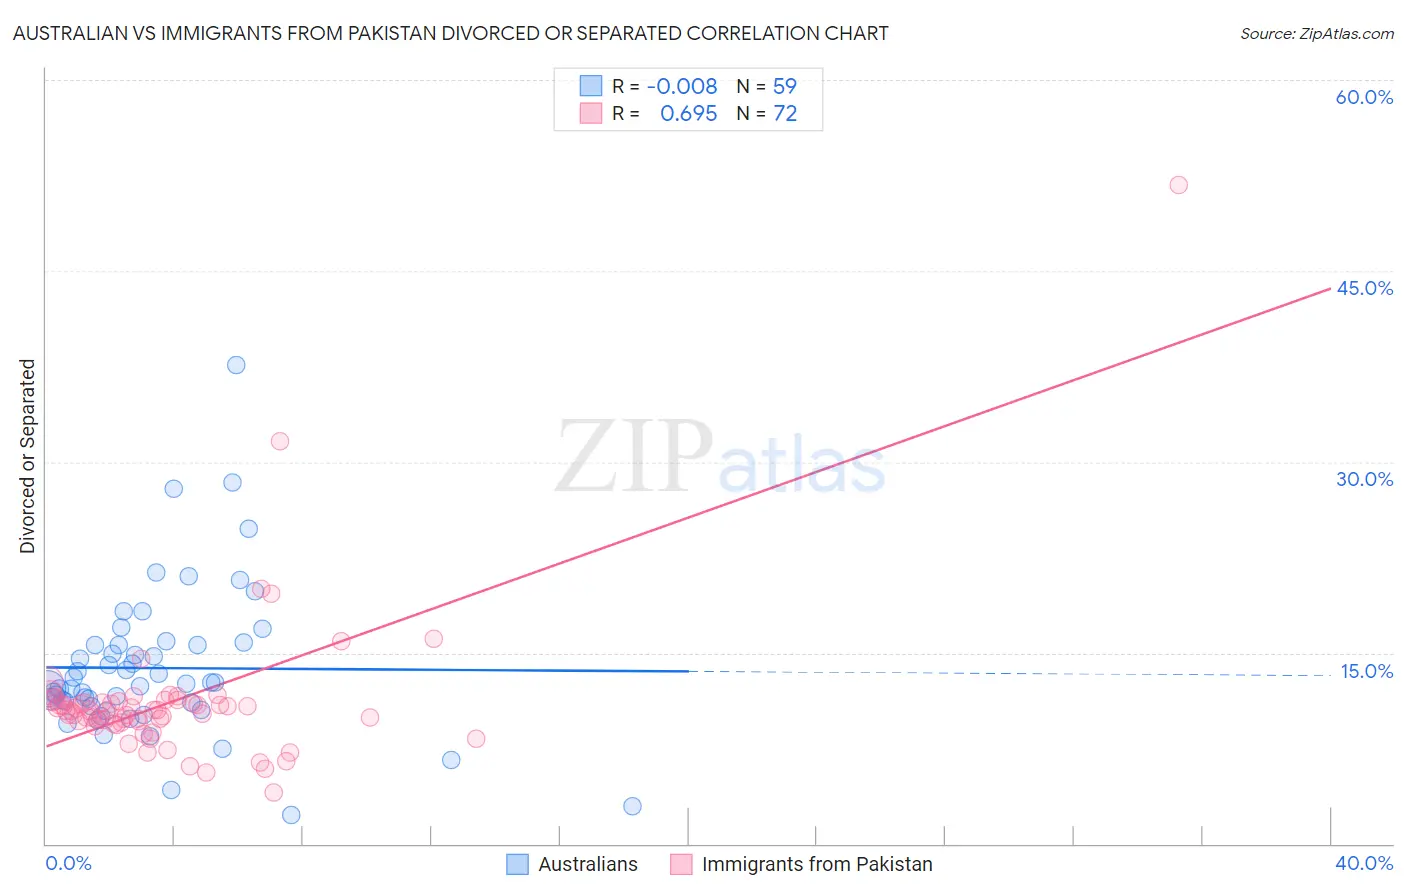
Australian vs Immigrants from Pakistan Divorced or Separated Correlation Chart
The statistical analysis conducted on geographies consisting of 224,067,628 people shows no correlation between the proportion of Australians and percentage of population currently divorced or separated in the United States with a correlation coefficient (R) of -0.008 and weighted average of 11.9%. Similarly, the statistical analysis conducted on geographies consisting of 283,830,422 people shows a significant positive correlation between the proportion of Immigrants from Pakistan and percentage of population currently divorced or separated in the United States with a correlation coefficient (R) of 0.695 and weighted average of 10.8%, a difference of 10.3%.
Divorced or Separated Correlation Summary
| Measurement | Australian | Immigrants from Pakistan |
| Minimum | 2.3% | 4.0% |
| Maximum | 37.6% | 51.8% |
| Range | 35.3% | 47.8% |
| Mean | 13.8% | 11.2% |
| Median | 12.5% | 10.5% |
| Interquartile 25% (IQ1) | 10.8% | 9.6% |
| Interquartile 75% (IQ3) | 15.6% | 11.1% |
| Interquartile Range (IQR) | 4.9% | 1.6% |
| Standard Deviation (Sample) | 5.9% | 6.0% |
| Standard Deviation (Population) | 5.9% | 6.0% |
Similar Demographics by Divorced or Separated
Demographics Similar to Australians by Divorced or Separated
In terms of divorced or separated, the demographic groups most similar to Australians are Alsatian (11.9%, a difference of 0.020%), Immigrants from Netherlands (11.9%, a difference of 0.020%), Lebanese (11.9%, a difference of 0.020%), Immigrants from Morocco (11.9%, a difference of 0.050%), and Danish (11.9%, a difference of 0.080%).
| Demographics | Rating | Rank | Divorced or Separated |
| Immigrants | Afghanistan | 87.9 /100 | #132 | Excellent 11.8% |
| New Zealanders | 87.5 /100 | #133 | Excellent 11.9% |
| Argentineans | 85.1 /100 | #134 | Excellent 11.9% |
| Danes | 84.8 /100 | #135 | Excellent 11.9% |
| Carpatho Rusyns | 84.8 /100 | #136 | Excellent 11.9% |
| Alsatians | 84.0 /100 | #137 | Excellent 11.9% |
| Immigrants | Netherlands | 83.9 /100 | #138 | Excellent 11.9% |
| Australians | 83.6 /100 | #139 | Excellent 11.9% |
| Lebanese | 83.4 /100 | #140 | Excellent 11.9% |
| Immigrants | Morocco | 82.9 /100 | #141 | Excellent 11.9% |
| Immigrants | Zimbabwe | 81.5 /100 | #142 | Excellent 11.9% |
| Pakistanis | 81.3 /100 | #143 | Excellent 11.9% |
| Peruvians | 80.9 /100 | #144 | Excellent 11.9% |
| Croatians | 80.6 /100 | #145 | Excellent 11.9% |
| Immigrants | Grenada | 79.1 /100 | #146 | Good 11.9% |
Demographics Similar to Immigrants from Pakistan by Divorced or Separated
In terms of divorced or separated, the demographic groups most similar to Immigrants from Pakistan are Vietnamese (10.8%, a difference of 0.18%), Immigrants from Sri Lanka (10.8%, a difference of 0.19%), Iranian (10.8%, a difference of 0.24%), Immigrants from Asia (10.7%, a difference of 0.43%), and Burmese (10.7%, a difference of 0.62%).
| Demographics | Rating | Rank | Divorced or Separated |
| Immigrants | Korea | 100.0 /100 | #16 | Exceptional 10.6% |
| Immigrants | Israel | 100.0 /100 | #17 | Exceptional 10.6% |
| Immigrants | Iran | 100.0 /100 | #18 | Exceptional 10.6% |
| Asians | 100.0 /100 | #19 | Exceptional 10.6% |
| Burmese | 100.0 /100 | #20 | Exceptional 10.7% |
| Immigrants | Asia | 100.0 /100 | #21 | Exceptional 10.7% |
| Vietnamese | 100.0 /100 | #22 | Exceptional 10.8% |
| Immigrants | Pakistan | 100.0 /100 | #23 | Exceptional 10.8% |
| Immigrants | Sri Lanka | 100.0 /100 | #24 | Exceptional 10.8% |
| Iranians | 100.0 /100 | #25 | Exceptional 10.8% |
| Immigrants | Indonesia | 100.0 /100 | #26 | Exceptional 10.9% |
| Immigrants | Bangladesh | 100.0 /100 | #27 | Exceptional 11.0% |
| Immigrants | Malaysia | 100.0 /100 | #28 | Exceptional 11.0% |
| Armenians | 100.0 /100 | #29 | Exceptional 11.0% |
| Immigrants | Ireland | 100.0 /100 | #30 | Exceptional 11.0% |