Panamanian vs Creek Divorced or Separated
COMPARE
Panamanian
Creek
Divorced or Separated
Divorced or Separated Comparison
Panamanians
Creek
12.7%
DIVORCED OR SEPARATED
0.3/ 100
METRIC RATING
271st/ 347
METRIC RANK
14.4%
DIVORCED OR SEPARATED
0.0/ 100
METRIC RATING
343rd/ 347
METRIC RANK
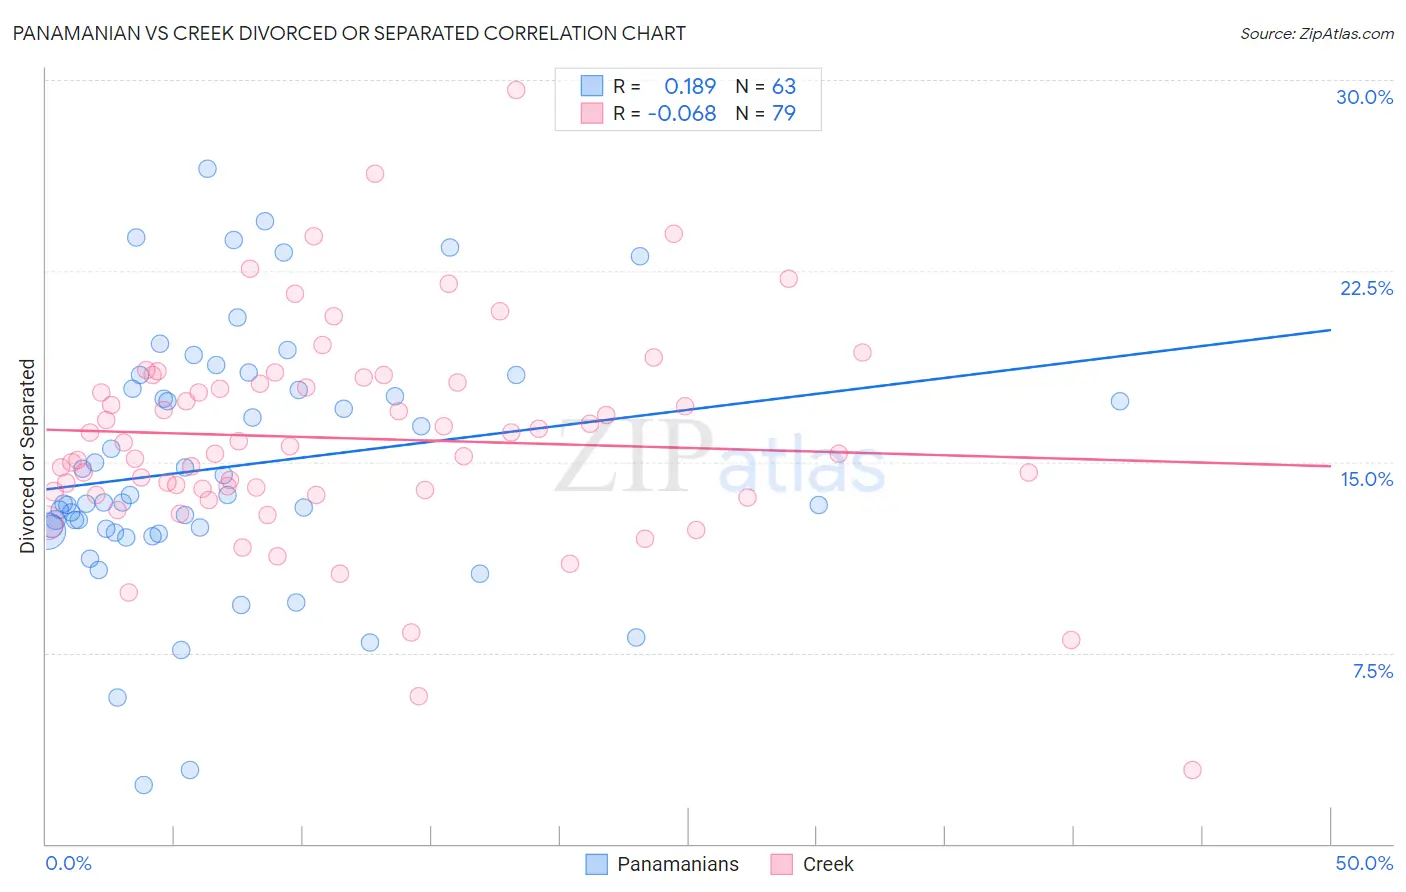
Panamanian vs Creek Divorced or Separated Correlation Chart
The statistical analysis conducted on geographies consisting of 281,170,767 people shows a poor positive correlation between the proportion of Panamanians and percentage of population currently divorced or separated in the United States with a correlation coefficient (R) of 0.189 and weighted average of 12.7%. Similarly, the statistical analysis conducted on geographies consisting of 178,467,072 people shows a slight negative correlation between the proportion of Creek and percentage of population currently divorced or separated in the United States with a correlation coefficient (R) of -0.068 and weighted average of 14.4%, a difference of 13.9%.
Divorced or Separated Correlation Summary
| Measurement | Panamanian | Creek |
| Minimum | 2.3% | 2.9% |
| Maximum | 26.5% | 29.6% |
| Range | 24.2% | 26.7% |
| Mean | 14.8% | 15.9% |
| Median | 13.4% | 15.6% |
| Interquartile 25% (IQ1) | 12.3% | 13.8% |
| Interquartile 75% (IQ3) | 17.9% | 18.1% |
| Interquartile Range (IQR) | 5.6% | 4.3% |
| Standard Deviation (Sample) | 5.0% | 4.2% |
| Standard Deviation (Population) | 4.9% | 4.2% |
Similar Demographics by Divorced or Separated
Demographics Similar to Panamanians by Divorced or Separated
In terms of divorced or separated, the demographic groups most similar to Panamanians are Immigrants from Middle Africa (12.7%, a difference of 0.050%), Ute (12.6%, a difference of 0.060%), Immigrants from Micronesia (12.7%, a difference of 0.16%), Immigrants from Liberia (12.6%, a difference of 0.18%), and Bermudan (12.7%, a difference of 0.18%).
| Demographics | Rating | Rank | Divorced or Separated |
| English | 0.5 /100 | #264 | Tragic 12.6% |
| Immigrants | Senegal | 0.5 /100 | #265 | Tragic 12.6% |
| Whites/Caucasians | 0.5 /100 | #266 | Tragic 12.6% |
| Scottish | 0.4 /100 | #267 | Tragic 12.6% |
| Fijians | 0.4 /100 | #268 | Tragic 12.6% |
| Immigrants | Liberia | 0.4 /100 | #269 | Tragic 12.6% |
| Ute | 0.4 /100 | #270 | Tragic 12.6% |
| Panamanians | 0.3 /100 | #271 | Tragic 12.7% |
| Immigrants | Middle Africa | 0.3 /100 | #272 | Tragic 12.7% |
| Immigrants | Micronesia | 0.3 /100 | #273 | Tragic 12.7% |
| Bermudans | 0.3 /100 | #274 | Tragic 12.7% |
| Central American Indians | 0.3 /100 | #275 | Tragic 12.7% |
| Spaniards | 0.2 /100 | #276 | Tragic 12.7% |
| Dominicans | 0.2 /100 | #277 | Tragic 12.7% |
| Lumbee | 0.2 /100 | #278 | Tragic 12.7% |
Demographics Similar to Creek by Divorced or Separated
In terms of divorced or separated, the demographic groups most similar to Creek are Cuban (14.5%, a difference of 0.68%), Kiowa (14.5%, a difference of 0.77%), Seminole (14.3%, a difference of 1.1%), Bahamian (14.2%, a difference of 1.2%), and Chickasaw (14.2%, a difference of 1.4%).
| Demographics | Rating | Rank | Divorced or Separated |
| Puerto Ricans | 0.0 /100 | #333 | Tragic 13.9% |
| Immigrants | Bahamas | 0.0 /100 | #334 | Tragic 13.9% |
| Dutch West Indians | 0.0 /100 | #335 | Tragic 14.0% |
| Shoshone | 0.0 /100 | #336 | Tragic 14.0% |
| Crow | 0.0 /100 | #337 | Tragic 14.1% |
| Choctaw | 0.0 /100 | #338 | Tragic 14.1% |
| Colville | 0.0 /100 | #339 | Tragic 14.2% |
| Chickasaw | 0.0 /100 | #340 | Tragic 14.2% |
| Bahamians | 0.0 /100 | #341 | Tragic 14.2% |
| Seminole | 0.0 /100 | #342 | Tragic 14.3% |
| Creek | 0.0 /100 | #343 | Tragic 14.4% |
| Cubans | 0.0 /100 | #344 | Tragic 14.5% |
| Kiowa | 0.0 /100 | #345 | Tragic 14.5% |
| Arapaho | 0.0 /100 | #346 | Tragic 14.8% |
| Immigrants | Cuba | 0.0 /100 | #347 | Tragic 15.2% |