Palestinian vs Salvadoran Family Households with Children
COMPARE
Palestinian
Salvadoran
Family Households with Children
Family Households with Children Comparison
Palestinians
Salvadorans
28.1%
FAMILY HOUSEHOLDS WITH CHILDREN
98.5/ 100
METRIC RATING
103rd/ 347
METRIC RANK
29.9%
FAMILY HOUSEHOLDS WITH CHILDREN
100.0/ 100
METRIC RATING
18th/ 347
METRIC RANK
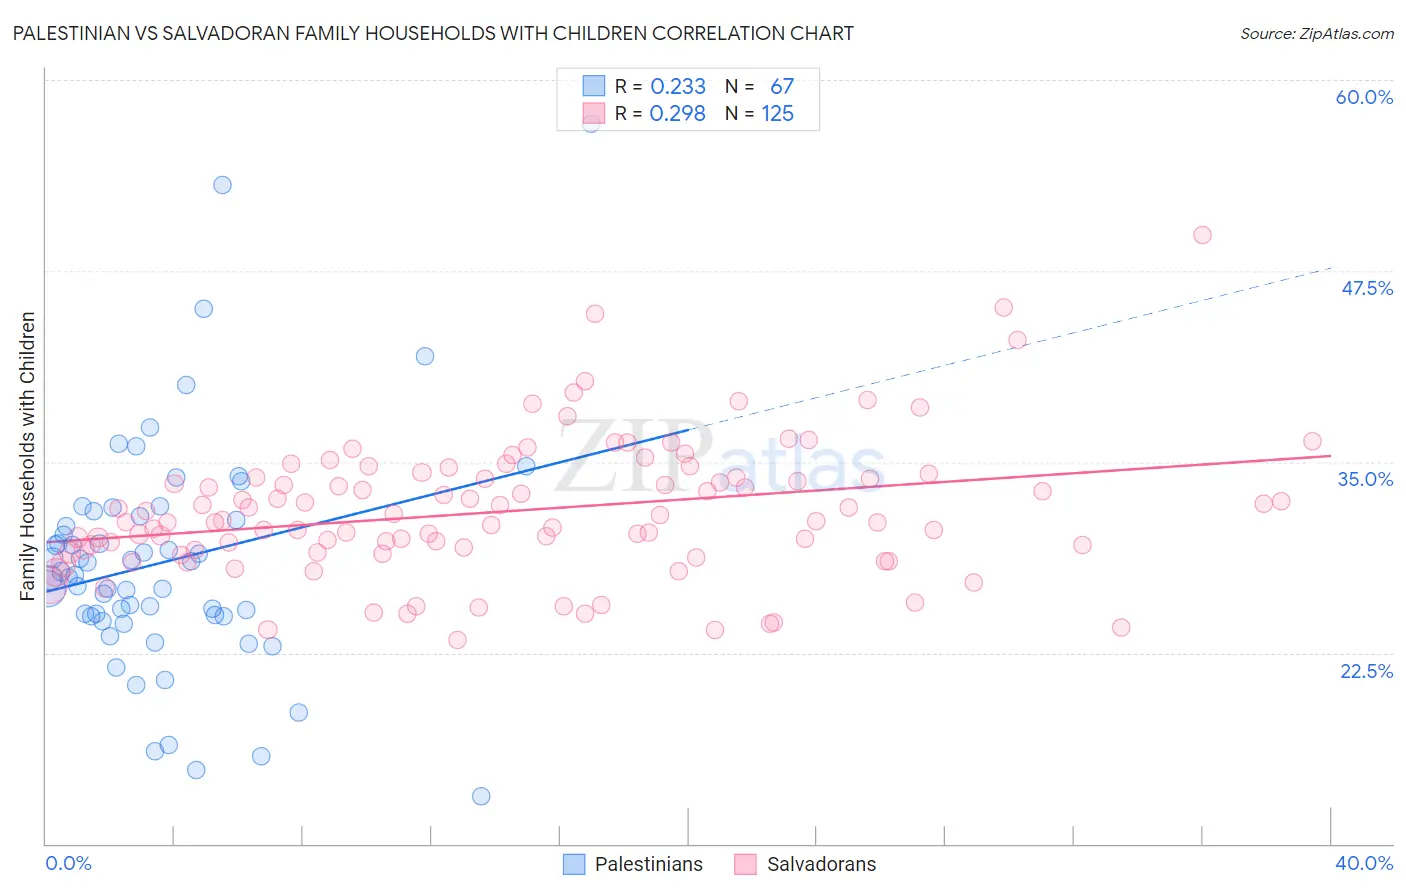
Palestinian vs Salvadoran Family Households with Children Correlation Chart
The statistical analysis conducted on geographies consisting of 216,372,515 people shows a weak positive correlation between the proportion of Palestinians and percentage of family households with children in the United States with a correlation coefficient (R) of 0.233 and weighted average of 28.1%. Similarly, the statistical analysis conducted on geographies consisting of 398,611,011 people shows a weak positive correlation between the proportion of Salvadorans and percentage of family households with children in the United States with a correlation coefficient (R) of 0.298 and weighted average of 29.9%, a difference of 6.4%.
Family Households with Children Correlation Summary
| Measurement | Palestinian | Salvadoran |
| Minimum | 13.1% | 23.4% |
| Maximum | 57.1% | 49.9% |
| Range | 44.1% | 26.5% |
| Mean | 28.4% | 31.8% |
| Median | 27.6% | 31.1% |
| Interquartile 25% (IQ1) | 24.9% | 29.2% |
| Interquartile 75% (IQ3) | 31.4% | 34.0% |
| Interquartile Range (IQR) | 6.5% | 4.8% |
| Standard Deviation (Sample) | 7.6% | 4.5% |
| Standard Deviation (Population) | 7.6% | 4.5% |
Similar Demographics by Family Households with Children
Demographics Similar to Palestinians by Family Households with Children
In terms of family households with children, the demographic groups most similar to Palestinians are Sioux (28.1%, a difference of 0.050%), Choctaw (28.1%, a difference of 0.050%), Assyrian/Chaldean/Syriac (28.1%, a difference of 0.10%), Immigrants from Oceania (28.1%, a difference of 0.13%), and Immigrants from the Azores (28.1%, a difference of 0.15%).
| Demographics | Rating | Rank | Family Households with Children |
| Ute | 99.1 /100 | #96 | Exceptional 28.2% |
| Chileans | 98.9 /100 | #97 | Exceptional 28.1% |
| Immigrants | Kenya | 98.9 /100 | #98 | Exceptional 28.1% |
| Immigrants | Azores | 98.8 /100 | #99 | Exceptional 28.1% |
| Indonesians | 98.8 /100 | #100 | Exceptional 28.1% |
| Immigrants | Oceania | 98.8 /100 | #101 | Exceptional 28.1% |
| Assyrians/Chaldeans/Syriacs | 98.7 /100 | #102 | Exceptional 28.1% |
| Palestinians | 98.5 /100 | #103 | Exceptional 28.1% |
| Sioux | 98.3 /100 | #104 | Exceptional 28.1% |
| Choctaw | 98.3 /100 | #105 | Exceptional 28.1% |
| Immigrants | South America | 98.0 /100 | #106 | Exceptional 28.0% |
| Immigrants | Uganda | 97.7 /100 | #107 | Exceptional 28.0% |
| Immigrants | Burma/Myanmar | 97.7 /100 | #108 | Exceptional 28.0% |
| Tohono O'odham | 97.6 /100 | #109 | Exceptional 28.0% |
| Spaniards | 97.4 /100 | #110 | Exceptional 28.0% |
Demographics Similar to Salvadorans by Family Households with Children
In terms of family households with children, the demographic groups most similar to Salvadorans are Alaska Native (29.9%, a difference of 0.040%), Immigrants from El Salvador (29.8%, a difference of 0.070%), Immigrants from Laos (29.8%, a difference of 0.11%), Malaysian (29.8%, a difference of 0.14%), and Hispanic or Latino (29.9%, a difference of 0.19%).
| Demographics | Rating | Rank | Family Households with Children |
| Nepalese | 100.0 /100 | #11 | Exceptional 30.5% |
| Immigrants | Pakistan | 100.0 /100 | #12 | Exceptional 30.2% |
| Afghans | 100.0 /100 | #13 | Exceptional 30.2% |
| Bangladeshis | 100.0 /100 | #14 | Exceptional 30.1% |
| Immigrants | South Central Asia | 100.0 /100 | #15 | Exceptional 30.0% |
| Immigrants | Afghanistan | 100.0 /100 | #16 | Exceptional 30.0% |
| Hispanics or Latinos | 100.0 /100 | #17 | Exceptional 29.9% |
| Salvadorans | 100.0 /100 | #18 | Exceptional 29.9% |
| Alaska Natives | 100.0 /100 | #19 | Exceptional 29.9% |
| Immigrants | El Salvador | 100.0 /100 | #20 | Exceptional 29.8% |
| Immigrants | Laos | 100.0 /100 | #21 | Exceptional 29.8% |
| Malaysians | 100.0 /100 | #22 | Exceptional 29.8% |
| Mexican American Indians | 100.0 /100 | #23 | Exceptional 29.7% |
| Guamanians/Chamorros | 100.0 /100 | #24 | Exceptional 29.7% |
| Immigrants | Latin America | 100.0 /100 | #25 | Exceptional 29.7% |