Immigrants from Cameroon vs Salvadoran Family Households with Children
COMPARE
Immigrants from Cameroon
Salvadoran
Family Households with Children
Family Households with Children Comparison
Immigrants from Cameroon
Salvadorans
29.2%
FAMILY HOUSEHOLDS WITH CHILDREN
100.0/ 100
METRIC RATING
37th/ 347
METRIC RANK
29.9%
FAMILY HOUSEHOLDS WITH CHILDREN
100.0/ 100
METRIC RATING
18th/ 347
METRIC RANK
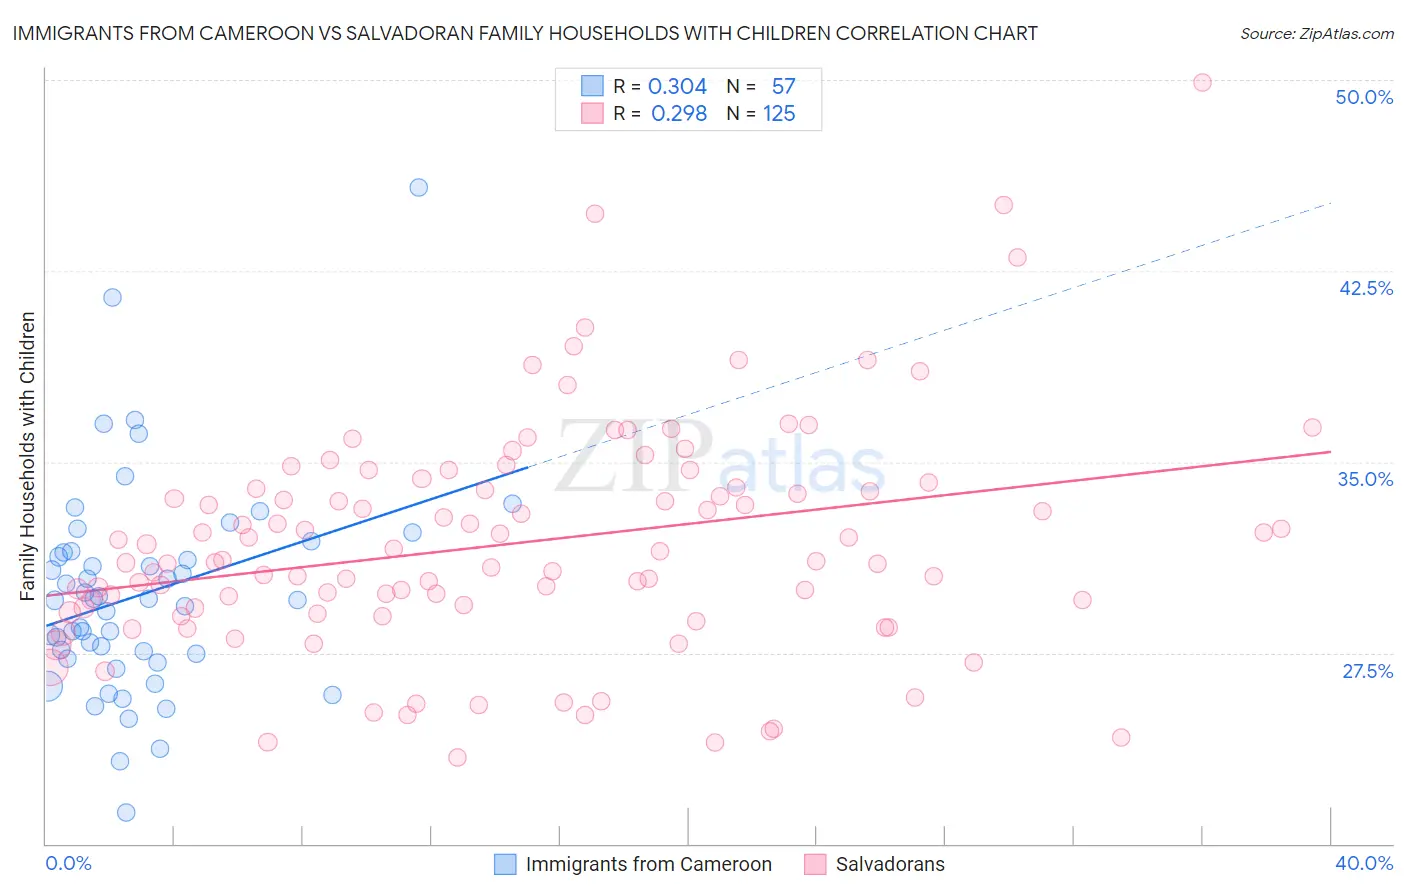
Immigrants from Cameroon vs Salvadoran Family Households with Children Correlation Chart
The statistical analysis conducted on geographies consisting of 130,728,494 people shows a mild positive correlation between the proportion of Immigrants from Cameroon and percentage of family households with children in the United States with a correlation coefficient (R) of 0.304 and weighted average of 29.2%. Similarly, the statistical analysis conducted on geographies consisting of 398,611,011 people shows a weak positive correlation between the proportion of Salvadorans and percentage of family households with children in the United States with a correlation coefficient (R) of 0.298 and weighted average of 29.9%, a difference of 2.2%.
Family Households with Children Correlation Summary
| Measurement | Immigrants from Cameroon | Salvadoran |
| Minimum | 21.2% | 23.4% |
| Maximum | 45.8% | 49.9% |
| Range | 24.6% | 26.5% |
| Mean | 29.8% | 31.8% |
| Median | 29.6% | 31.1% |
| Interquartile 25% (IQ1) | 27.4% | 29.2% |
| Interquartile 75% (IQ3) | 31.5% | 34.0% |
| Interquartile Range (IQR) | 4.1% | 4.8% |
| Standard Deviation (Sample) | 4.2% | 4.5% |
| Standard Deviation (Population) | 4.1% | 4.5% |
Demographics Similar to Immigrants from Cameroon and Salvadorans by Family Households with Children
In terms of family households with children, the demographic groups most similar to Immigrants from Cameroon are Immigrants from Venezuela (29.3%, a difference of 0.27%), Immigrants from Sierra Leone (29.3%, a difference of 0.28%), Immigrants from Bolivia (29.3%, a difference of 0.44%), Venezuelan (29.4%, a difference of 0.49%), and Immigrants from Yemen (29.4%, a difference of 0.69%). Similarly, the demographic groups most similar to Salvadorans are Alaska Native (29.9%, a difference of 0.040%), Immigrants from El Salvador (29.8%, a difference of 0.070%), Immigrants from Laos (29.8%, a difference of 0.11%), Malaysian (29.8%, a difference of 0.14%), and Hispanic or Latino (29.9%, a difference of 0.19%).
| Demographics | Rating | Rank | Family Households with Children |
| Hispanics or Latinos | 100.0 /100 | #17 | Exceptional 29.9% |
| Salvadorans | 100.0 /100 | #18 | Exceptional 29.9% |
| Alaska Natives | 100.0 /100 | #19 | Exceptional 29.9% |
| Immigrants | El Salvador | 100.0 /100 | #20 | Exceptional 29.8% |
| Immigrants | Laos | 100.0 /100 | #21 | Exceptional 29.8% |
| Malaysians | 100.0 /100 | #22 | Exceptional 29.8% |
| Mexican American Indians | 100.0 /100 | #23 | Exceptional 29.7% |
| Guamanians/Chamorros | 100.0 /100 | #24 | Exceptional 29.7% |
| Immigrants | Latin America | 100.0 /100 | #25 | Exceptional 29.7% |
| Sri Lankans | 100.0 /100 | #26 | Exceptional 29.5% |
| Immigrants | Vietnam | 100.0 /100 | #27 | Exceptional 29.5% |
| Samoans | 100.0 /100 | #28 | Exceptional 29.5% |
| Bolivians | 100.0 /100 | #29 | Exceptional 29.5% |
| Yuman | 100.0 /100 | #30 | Exceptional 29.5% |
| Japanese | 100.0 /100 | #31 | Exceptional 29.4% |
| Immigrants | Yemen | 100.0 /100 | #32 | Exceptional 29.4% |
| Venezuelans | 100.0 /100 | #33 | Exceptional 29.4% |
| Immigrants | Bolivia | 100.0 /100 | #34 | Exceptional 29.3% |
| Immigrants | Sierra Leone | 100.0 /100 | #35 | Exceptional 29.3% |
| Immigrants | Venezuela | 100.0 /100 | #36 | Exceptional 29.3% |
| Immigrants | Cameroon | 100.0 /100 | #37 | Exceptional 29.2% |