Native Hawaiian vs Haitian Single Father Households
COMPARE
Native Hawaiian
Haitian
Single Father Households
Single Father Households Comparison
Native Hawaiians
Haitians
2.5%
SINGLE FATHER HOUSEHOLDS
2.5/ 100
METRIC RATING
246th/ 347
METRIC RANK
2.6%
SINGLE FATHER HOUSEHOLDS
0.4/ 100
METRIC RATING
268th/ 347
METRIC RANK
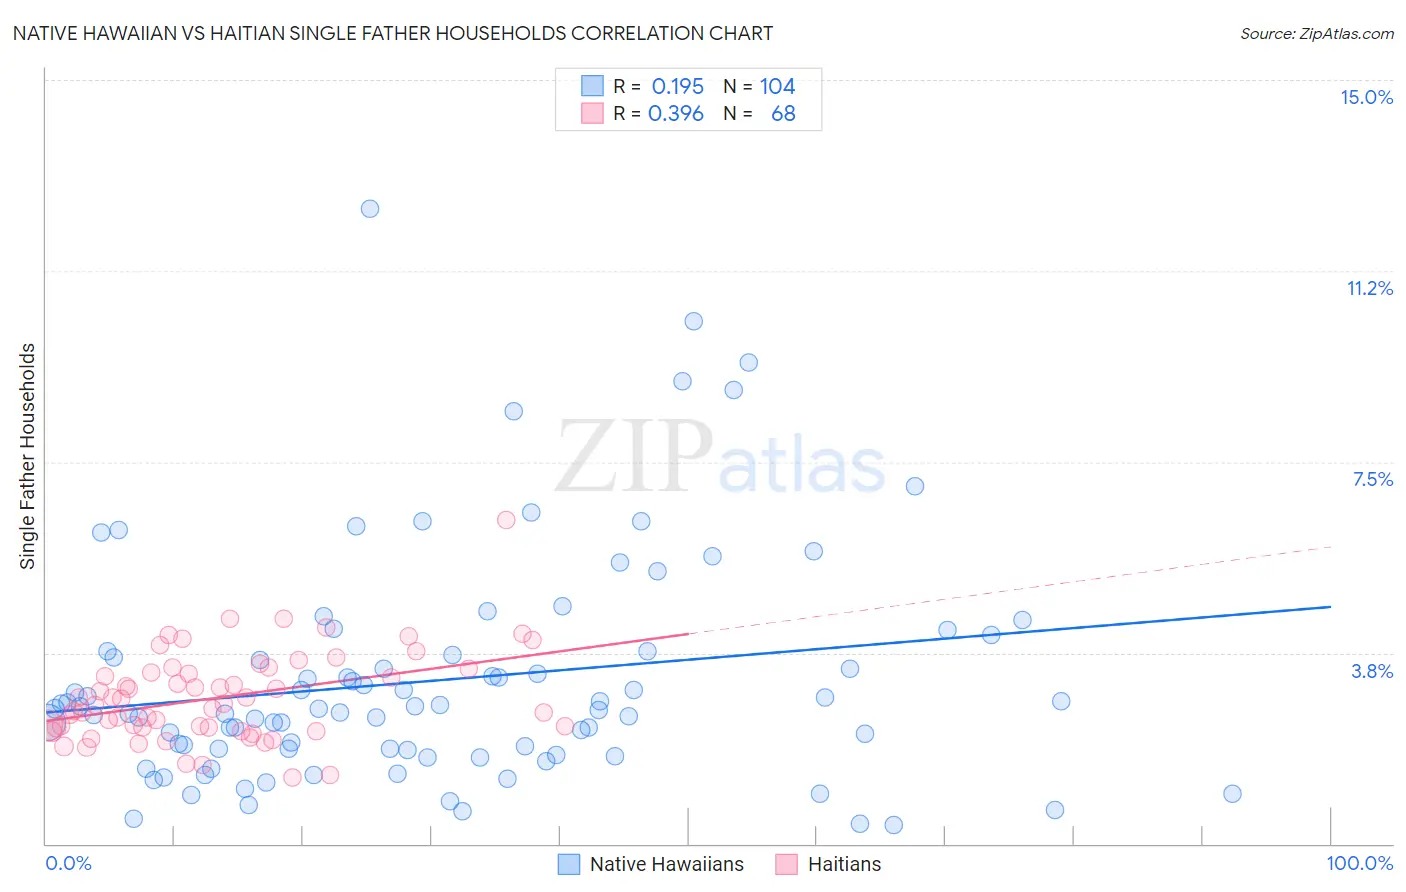
Native Hawaiian vs Haitian Single Father Households Correlation Chart
The statistical analysis conducted on geographies consisting of 329,768,096 people shows a poor positive correlation between the proportion of Native Hawaiians and percentage of single father households in the United States with a correlation coefficient (R) of 0.195 and weighted average of 2.5%. Similarly, the statistical analysis conducted on geographies consisting of 285,939,112 people shows a mild positive correlation between the proportion of Haitians and percentage of single father households in the United States with a correlation coefficient (R) of 0.396 and weighted average of 2.6%, a difference of 3.4%.
Single Father Households Correlation Summary
| Measurement | Native Hawaiian | Haitian |
| Minimum | 0.37% | 1.3% |
| Maximum | 12.5% | 6.4% |
| Range | 12.1% | 5.1% |
| Mean | 3.2% | 2.9% |
| Median | 2.6% | 2.7% |
| Interquartile 25% (IQ1) | 1.8% | 2.3% |
| Interquartile 75% (IQ3) | 3.7% | 3.4% |
| Interquartile Range (IQR) | 1.9% | 1.1% |
| Standard Deviation (Sample) | 2.2% | 0.88% |
| Standard Deviation (Population) | 2.2% | 0.87% |
Similar Demographics by Single Father Households
Demographics Similar to Native Hawaiians by Single Father Households
In terms of single father households, the demographic groups most similar to Native Hawaiians are Basque (2.5%, a difference of 0.020%), Delaware (2.5%, a difference of 0.020%), Bahamian (2.5%, a difference of 0.060%), Immigrants from Cameroon (2.5%, a difference of 0.14%), and Immigrants from Middle Africa (2.5%, a difference of 0.23%).
| Demographics | Rating | Rank | Single Father Households |
| Immigrants | Oceania | 5.8 /100 | #239 | Tragic 2.5% |
| Immigrants | Dominica | 4.8 /100 | #240 | Tragic 2.5% |
| Portuguese | 4.1 /100 | #241 | Tragic 2.5% |
| Osage | 4.1 /100 | #242 | Tragic 2.5% |
| Spaniards | 3.1 /100 | #243 | Tragic 2.5% |
| Immigrants | Middle Africa | 2.8 /100 | #244 | Tragic 2.5% |
| Basques | 2.5 /100 | #245 | Tragic 2.5% |
| Native Hawaiians | 2.5 /100 | #246 | Tragic 2.5% |
| Delaware | 2.5 /100 | #247 | Tragic 2.5% |
| Bahamians | 2.4 /100 | #248 | Tragic 2.5% |
| Immigrants | Cameroon | 2.3 /100 | #249 | Tragic 2.5% |
| Somalis | 2.1 /100 | #250 | Tragic 2.5% |
| Liberians | 2.0 /100 | #251 | Tragic 2.5% |
| Immigrants | Eritrea | 2.0 /100 | #252 | Tragic 2.5% |
| Immigrants | Somalia | 1.9 /100 | #253 | Tragic 2.5% |
Demographics Similar to Haitians by Single Father Households
In terms of single father households, the demographic groups most similar to Haitians are Guamanian/Chamorro (2.6%, a difference of 0.040%), Cuban (2.6%, a difference of 0.34%), Seminole (2.6%, a difference of 0.48%), French American Indian (2.6%, a difference of 0.52%), and Immigrants from Micronesia (2.6%, a difference of 0.56%).
| Demographics | Rating | Rank | Single Father Households |
| Immigrants | Belize | 0.9 /100 | #261 | Tragic 2.5% |
| Immigrants | Liberia | 0.8 /100 | #262 | Tragic 2.5% |
| Dominicans | 0.8 /100 | #263 | Tragic 2.5% |
| Indonesians | 0.5 /100 | #264 | Tragic 2.6% |
| Immigrants | Micronesia | 0.5 /100 | #265 | Tragic 2.6% |
| French American Indians | 0.5 /100 | #266 | Tragic 2.6% |
| Guamanians/Chamorros | 0.4 /100 | #267 | Tragic 2.6% |
| Haitians | 0.4 /100 | #268 | Tragic 2.6% |
| Cubans | 0.3 /100 | #269 | Tragic 2.6% |
| Seminole | 0.3 /100 | #270 | Tragic 2.6% |
| Creek | 0.2 /100 | #271 | Tragic 2.6% |
| Belizeans | 0.2 /100 | #272 | Tragic 2.6% |
| Iroquois | 0.2 /100 | #273 | Tragic 2.6% |
| Puerto Ricans | 0.2 /100 | #274 | Tragic 2.6% |
| Immigrants | Dominican Republic | 0.2 /100 | #275 | Tragic 2.6% |