Austrian vs Haitian Single Father Households
COMPARE
Austrian
Haitian
Single Father Households
Single Father Households Comparison
Austrians
Haitians
2.2%
SINGLE FATHER HOUSEHOLDS
94.2/ 100
METRIC RATING
137th/ 347
METRIC RANK
2.6%
SINGLE FATHER HOUSEHOLDS
0.4/ 100
METRIC RATING
268th/ 347
METRIC RANK
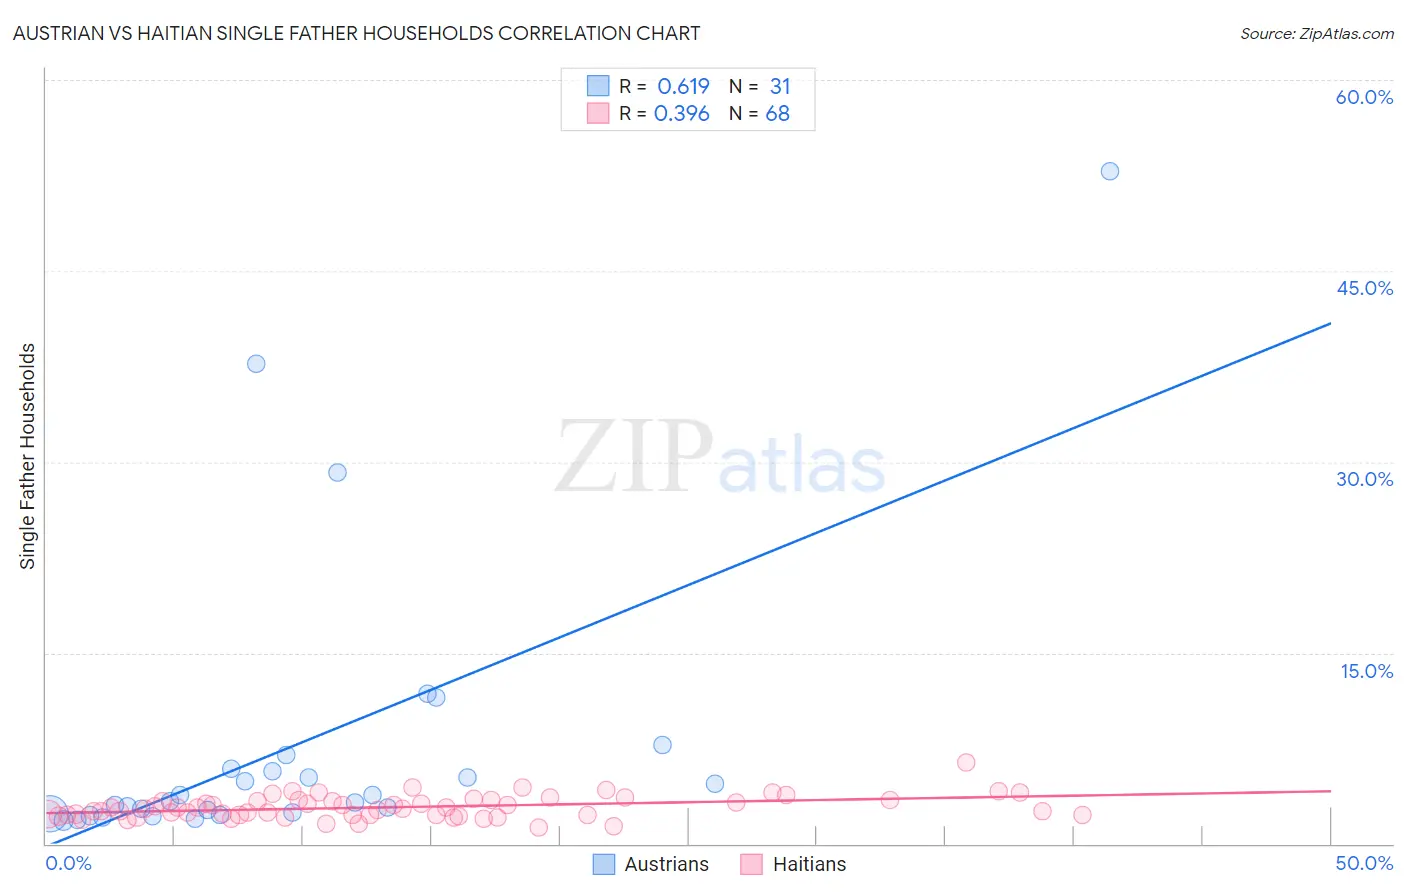
Austrian vs Haitian Single Father Households Correlation Chart
The statistical analysis conducted on geographies consisting of 445,997,732 people shows a significant positive correlation between the proportion of Austrians and percentage of single father households in the United States with a correlation coefficient (R) of 0.619 and weighted average of 2.2%. Similarly, the statistical analysis conducted on geographies consisting of 285,939,112 people shows a mild positive correlation between the proportion of Haitians and percentage of single father households in the United States with a correlation coefficient (R) of 0.396 and weighted average of 2.6%, a difference of 16.3%.
Single Father Households Correlation Summary
| Measurement | Austrian | Haitian |
| Minimum | 1.8% | 1.3% |
| Maximum | 52.8% | 6.4% |
| Range | 51.0% | 5.1% |
| Mean | 7.7% | 2.9% |
| Median | 3.4% | 2.7% |
| Interquartile 25% (IQ1) | 2.3% | 2.3% |
| Interquartile 75% (IQ3) | 5.9% | 3.4% |
| Interquartile Range (IQR) | 3.6% | 1.1% |
| Standard Deviation (Sample) | 11.4% | 0.88% |
| Standard Deviation (Population) | 11.3% | 0.87% |
Similar Demographics by Single Father Households
Demographics Similar to Austrians by Single Father Households
In terms of single father households, the demographic groups most similar to Austrians are West Indian (2.2%, a difference of 0.030%), Chilean (2.2%, a difference of 0.11%), Syrian (2.2%, a difference of 0.23%), Zimbabwean (2.2%, a difference of 0.34%), and Brazilian (2.2%, a difference of 0.45%).
| Demographics | Rating | Rank | Single Father Households |
| Immigrants | Chile | 96.7 /100 | #130 | Exceptional 2.2% |
| Immigrants | Jordan | 96.6 /100 | #131 | Exceptional 2.2% |
| Poles | 96.5 /100 | #132 | Exceptional 2.2% |
| Taiwanese | 96.3 /100 | #133 | Exceptional 2.2% |
| Zimbabweans | 95.1 /100 | #134 | Exceptional 2.2% |
| Syrians | 94.8 /100 | #135 | Exceptional 2.2% |
| Chileans | 94.5 /100 | #136 | Exceptional 2.2% |
| Austrians | 94.2 /100 | #137 | Exceptional 2.2% |
| West Indians | 94.1 /100 | #138 | Exceptional 2.2% |
| Brazilians | 92.8 /100 | #139 | Exceptional 2.2% |
| British | 92.8 /100 | #140 | Exceptional 2.2% |
| Laotians | 92.5 /100 | #141 | Exceptional 2.2% |
| Luxembourgers | 92.3 /100 | #142 | Exceptional 2.2% |
| Immigrants | Nepal | 92.1 /100 | #143 | Exceptional 2.2% |
| Slovaks | 90.7 /100 | #144 | Exceptional 2.2% |
Demographics Similar to Haitians by Single Father Households
In terms of single father households, the demographic groups most similar to Haitians are Guamanian/Chamorro (2.6%, a difference of 0.040%), Cuban (2.6%, a difference of 0.34%), Seminole (2.6%, a difference of 0.48%), French American Indian (2.6%, a difference of 0.52%), and Immigrants from Micronesia (2.6%, a difference of 0.56%).
| Demographics | Rating | Rank | Single Father Households |
| Immigrants | Belize | 0.9 /100 | #261 | Tragic 2.5% |
| Immigrants | Liberia | 0.8 /100 | #262 | Tragic 2.5% |
| Dominicans | 0.8 /100 | #263 | Tragic 2.5% |
| Indonesians | 0.5 /100 | #264 | Tragic 2.6% |
| Immigrants | Micronesia | 0.5 /100 | #265 | Tragic 2.6% |
| French American Indians | 0.5 /100 | #266 | Tragic 2.6% |
| Guamanians/Chamorros | 0.4 /100 | #267 | Tragic 2.6% |
| Haitians | 0.4 /100 | #268 | Tragic 2.6% |
| Cubans | 0.3 /100 | #269 | Tragic 2.6% |
| Seminole | 0.3 /100 | #270 | Tragic 2.6% |
| Creek | 0.2 /100 | #271 | Tragic 2.6% |
| Belizeans | 0.2 /100 | #272 | Tragic 2.6% |
| Iroquois | 0.2 /100 | #273 | Tragic 2.6% |
| Puerto Ricans | 0.2 /100 | #274 | Tragic 2.6% |
| Immigrants | Dominican Republic | 0.2 /100 | #275 | Tragic 2.6% |