Norwegian vs Immigrants from China Divorced or Separated
COMPARE
Norwegian
Immigrants from China
Divorced or Separated
Divorced or Separated Comparison
Norwegians
Immigrants from China
12.1%
DIVORCED OR SEPARATED
33.2/ 100
METRIC RATING
192nd/ 347
METRIC RANK
10.0%
DIVORCED OR SEPARATED
100.0/ 100
METRIC RATING
4th/ 347
METRIC RANK
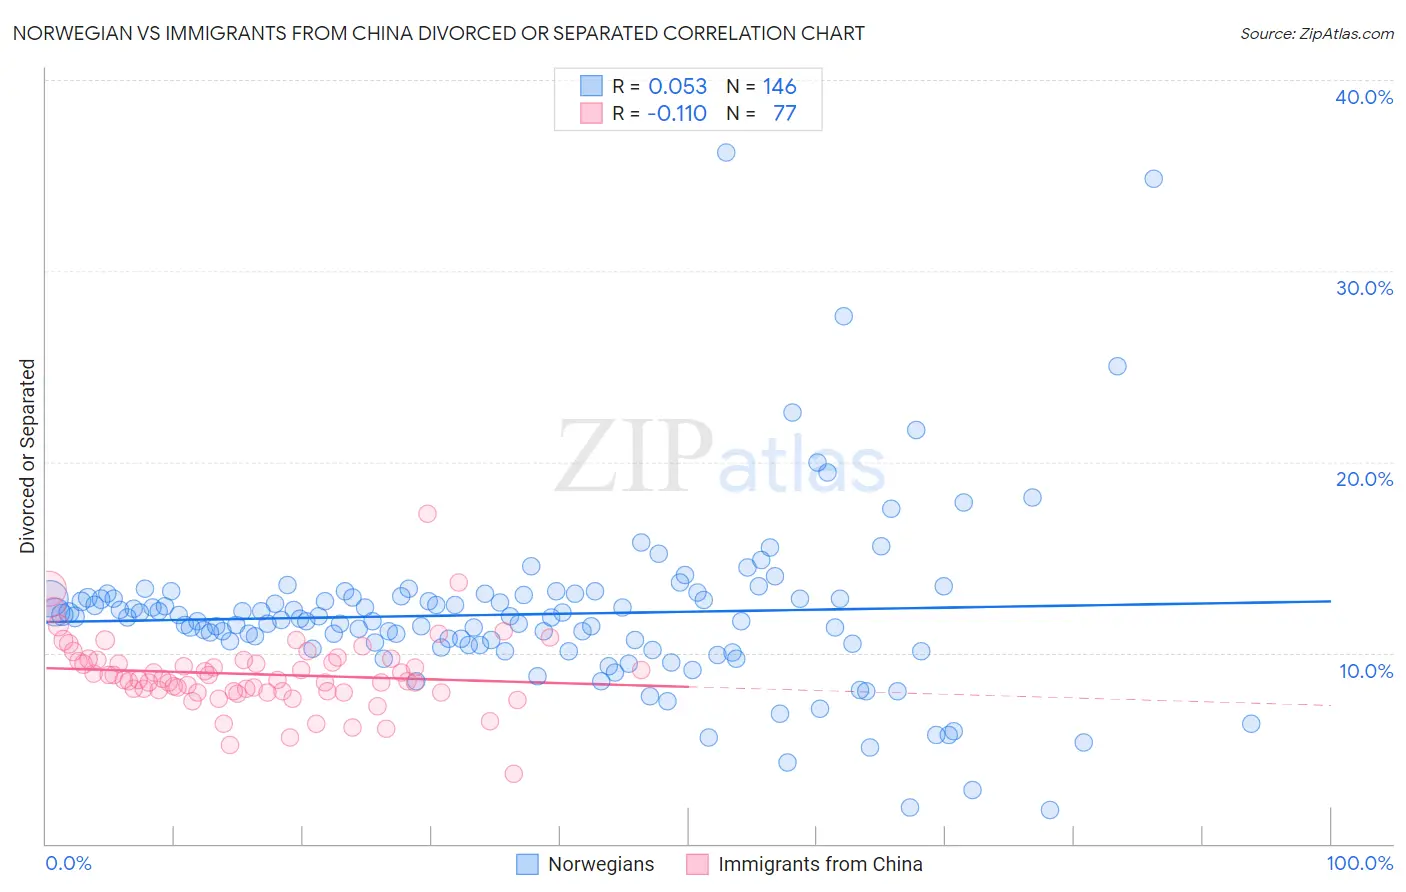
Norwegian vs Immigrants from China Divorced or Separated Correlation Chart
The statistical analysis conducted on geographies consisting of 533,039,037 people shows a slight positive correlation between the proportion of Norwegians and percentage of population currently divorced or separated in the United States with a correlation coefficient (R) of 0.053 and weighted average of 12.1%. Similarly, the statistical analysis conducted on geographies consisting of 456,716,224 people shows a poor negative correlation between the proportion of Immigrants from China and percentage of population currently divorced or separated in the United States with a correlation coefficient (R) of -0.110 and weighted average of 10.0%, a difference of 20.8%.
Divorced or Separated Correlation Summary
| Measurement | Norwegian | Immigrants from China |
| Minimum | 1.8% | 3.6% |
| Maximum | 36.2% | 17.3% |
| Range | 34.4% | 13.7% |
| Mean | 12.0% | 8.9% |
| Median | 11.8% | 8.6% |
| Interquartile 25% (IQ1) | 10.4% | 8.0% |
| Interquartile 75% (IQ3) | 12.9% | 9.6% |
| Interquartile Range (IQR) | 2.5% | 1.6% |
| Standard Deviation (Sample) | 4.5% | 1.9% |
| Standard Deviation (Population) | 4.5% | 1.9% |
Similar Demographics by Divorced or Separated
Demographics Similar to Norwegians by Divorced or Separated
In terms of divorced or separated, the demographic groups most similar to Norwegians are Immigrants from Thailand (12.1%, a difference of 0.030%), Swedish (12.1%, a difference of 0.050%), Immigrants from Eritrea (12.1%, a difference of 0.050%), Moroccan (12.1%, a difference of 0.060%), and Immigrants from England (12.1%, a difference of 0.070%).
| Demographics | Rating | Rank | Divorced or Separated |
| Immigrants | Nigeria | 40.5 /100 | #185 | Average 12.1% |
| Immigrants | Chile | 39.0 /100 | #186 | Fair 12.1% |
| Belizeans | 37.7 /100 | #187 | Fair 12.1% |
| Immigrants | Belize | 37.6 /100 | #188 | Fair 12.1% |
| Sierra Leoneans | 35.5 /100 | #189 | Fair 12.1% |
| Moroccans | 34.8 /100 | #190 | Fair 12.1% |
| Swedes | 34.4 /100 | #191 | Fair 12.1% |
| Norwegians | 33.2 /100 | #192 | Fair 12.1% |
| Immigrants | Thailand | 32.5 /100 | #193 | Fair 12.1% |
| Immigrants | Eritrea | 31.9 /100 | #194 | Fair 12.1% |
| Immigrants | England | 31.4 /100 | #195 | Fair 12.1% |
| Immigrants | Burma/Myanmar | 30.4 /100 | #196 | Fair 12.1% |
| Immigrants | Africa | 30.3 /100 | #197 | Fair 12.1% |
| Nigerians | 30.1 /100 | #198 | Fair 12.1% |
| Central Americans | 29.4 /100 | #199 | Fair 12.1% |
Demographics Similar to Immigrants from China by Divorced or Separated
In terms of divorced or separated, the demographic groups most similar to Immigrants from China are Immigrants from India (10.1%, a difference of 0.23%), Immigrants from Hong Kong (10.0%, a difference of 0.72%), Filipino (9.9%, a difference of 1.3%), Indian (Asian) (10.2%, a difference of 1.6%), and Thai (10.2%, a difference of 1.6%).
| Demographics | Rating | Rank | Divorced or Separated |
| Immigrants | Taiwan | 100.0 /100 | #1 | Exceptional 9.8% |
| Filipinos | 100.0 /100 | #2 | Exceptional 9.9% |
| Immigrants | Hong Kong | 100.0 /100 | #3 | Exceptional 10.0% |
| Immigrants | China | 100.0 /100 | #4 | Exceptional 10.0% |
| Immigrants | India | 100.0 /100 | #5 | Exceptional 10.1% |
| Indians (Asian) | 100.0 /100 | #6 | Exceptional 10.2% |
| Thais | 100.0 /100 | #7 | Exceptional 10.2% |
| Immigrants | Eastern Asia | 100.0 /100 | #8 | Exceptional 10.2% |
| Yup'ik | 100.0 /100 | #9 | Exceptional 10.3% |
| Immigrants | Singapore | 100.0 /100 | #10 | Exceptional 10.3% |
| Immigrants | South Central Asia | 100.0 /100 | #11 | Exceptional 10.4% |
| Okinawans | 100.0 /100 | #12 | Exceptional 10.5% |
| Cypriots | 100.0 /100 | #13 | Exceptional 10.5% |
| Assyrians/Chaldeans/Syriacs | 100.0 /100 | #14 | Exceptional 10.6% |
| Immigrants | Armenia | 100.0 /100 | #15 | Exceptional 10.6% |