Immigrants from Italy vs Immigrants from Ireland Single Mother Households
COMPARE
Immigrants from Italy
Immigrants from Ireland
Single Mother Households
Single Mother Households Comparison
Immigrants from Italy
Immigrants from Ireland
5.8%
SINGLE MOTHER HOUSEHOLDS
95.8/ 100
METRIC RATING
108th/ 347
METRIC RANK
5.0%
SINGLE MOTHER HOUSEHOLDS
99.9/ 100
METRIC RATING
8th/ 347
METRIC RANK
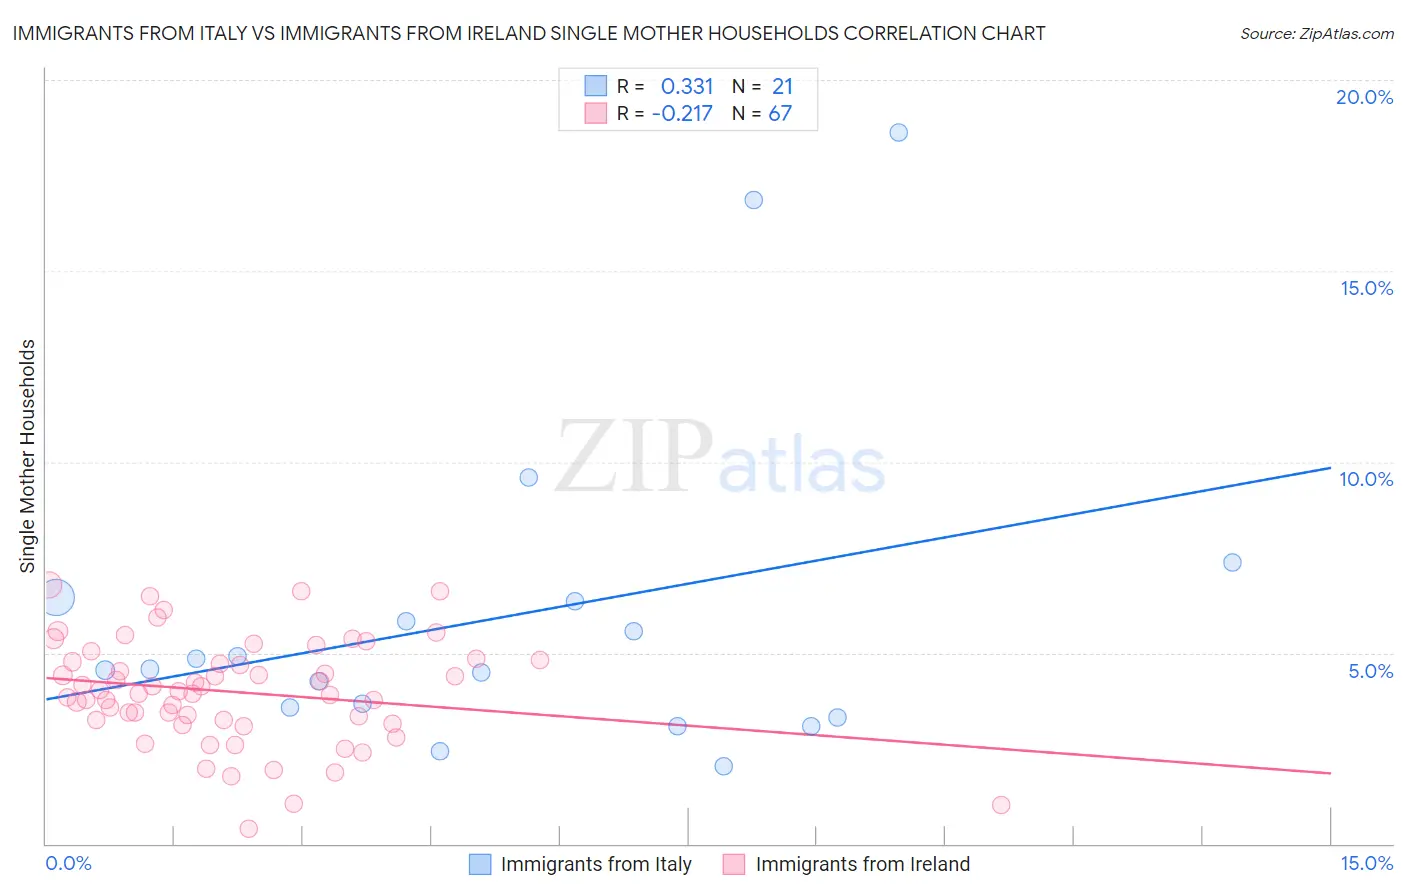
Immigrants from Italy vs Immigrants from Ireland Single Mother Households Correlation Chart
The statistical analysis conducted on geographies consisting of 323,232,887 people shows a mild positive correlation between the proportion of Immigrants from Italy and percentage of single mother households in the United States with a correlation coefficient (R) of 0.331 and weighted average of 5.8%. Similarly, the statistical analysis conducted on geographies consisting of 240,180,229 people shows a weak negative correlation between the proportion of Immigrants from Ireland and percentage of single mother households in the United States with a correlation coefficient (R) of -0.217 and weighted average of 5.0%, a difference of 15.3%.
Single Mother Households Correlation Summary
| Measurement | Immigrants from Italy | Immigrants from Ireland |
| Minimum | 2.0% | 0.40% |
| Maximum | 18.6% | 6.8% |
| Range | 16.6% | 6.4% |
| Mean | 6.0% | 4.0% |
| Median | 4.6% | 4.0% |
| Interquartile 25% (IQ1) | 3.4% | 3.2% |
| Interquartile 75% (IQ3) | 6.4% | 4.8% |
| Interquartile Range (IQR) | 3.0% | 1.6% |
| Standard Deviation (Sample) | 4.3% | 1.4% |
| Standard Deviation (Population) | 4.2% | 1.4% |
Similar Demographics by Single Mother Households
Demographics Similar to Immigrants from Italy by Single Mother Households
In terms of single mother households, the demographic groups most similar to Immigrants from Italy are Paraguayan (5.8%, a difference of 0.010%), Immigrants from Western Europe (5.8%, a difference of 0.090%), Immigrants from Ukraine (5.8%, a difference of 0.12%), British (5.8%, a difference of 0.18%), and Immigrants from England (5.8%, a difference of 0.21%).
| Demographics | Rating | Rank | Single Mother Households |
| Germans | 96.2 /100 | #101 | Exceptional 5.8% |
| English | 96.2 /100 | #102 | Exceptional 5.8% |
| Scottish | 96.2 /100 | #103 | Exceptional 5.8% |
| Northern Europeans | 96.2 /100 | #104 | Exceptional 5.8% |
| Taiwanese | 96.1 /100 | #105 | Exceptional 5.8% |
| Immigrants | Ukraine | 95.9 /100 | #106 | Exceptional 5.8% |
| Paraguayans | 95.8 /100 | #107 | Exceptional 5.8% |
| Immigrants | Italy | 95.8 /100 | #108 | Exceptional 5.8% |
| Immigrants | Western Europe | 95.7 /100 | #109 | Exceptional 5.8% |
| British | 95.5 /100 | #110 | Exceptional 5.8% |
| Immigrants | England | 95.5 /100 | #111 | Exceptional 5.8% |
| Immigrants | Kuwait | 95.4 /100 | #112 | Exceptional 5.8% |
| Mongolians | 95.3 /100 | #113 | Exceptional 5.8% |
| Dutch | 95.1 /100 | #114 | Exceptional 5.8% |
| Irish | 94.8 /100 | #115 | Exceptional 5.8% |
Demographics Similar to Immigrants from Ireland by Single Mother Households
In terms of single mother households, the demographic groups most similar to Immigrants from Ireland are Okinawan (5.0%, a difference of 0.15%), Immigrants from Israel (5.0%, a difference of 0.49%), Iranian (5.0%, a difference of 0.66%), Immigrants from Singapore (5.0%, a difference of 0.91%), and Immigrants from China (5.1%, a difference of 1.1%).
| Demographics | Rating | Rank | Single Mother Households |
| Immigrants | Taiwan | 100.0 /100 | #1 | Exceptional 4.7% |
| Filipinos | 100.0 /100 | #2 | Exceptional 4.7% |
| Immigrants | Iran | 100.0 /100 | #3 | Exceptional 4.8% |
| Assyrians/Chaldeans/Syriacs | 100.0 /100 | #4 | Exceptional 4.8% |
| Immigrants | Hong Kong | 100.0 /100 | #5 | Exceptional 4.8% |
| Immigrants | Singapore | 100.0 /100 | #6 | Exceptional 5.0% |
| Iranians | 100.0 /100 | #7 | Exceptional 5.0% |
| Immigrants | Ireland | 99.9 /100 | #8 | Exceptional 5.0% |
| Okinawans | 99.9 /100 | #9 | Exceptional 5.0% |
| Immigrants | Israel | 99.9 /100 | #10 | Exceptional 5.0% |
| Immigrants | China | 99.9 /100 | #11 | Exceptional 5.1% |
| Cypriots | 99.9 /100 | #12 | Exceptional 5.1% |
| Immigrants | India | 99.9 /100 | #13 | Exceptional 5.1% |
| Immigrants | Australia | 99.9 /100 | #14 | Exceptional 5.1% |
| Immigrants | Eastern Asia | 99.9 /100 | #15 | Exceptional 5.1% |