Immigrants from Uzbekistan vs Immigrants from China Divorced or Separated
COMPARE
Immigrants from Uzbekistan
Immigrants from China
Divorced or Separated
Divorced or Separated Comparison
Immigrants from Uzbekistan
Immigrants from China
11.1%
DIVORCED OR SEPARATED
100.0/ 100
METRIC RATING
34th/ 347
METRIC RANK
10.0%
DIVORCED OR SEPARATED
100.0/ 100
METRIC RATING
4th/ 347
METRIC RANK
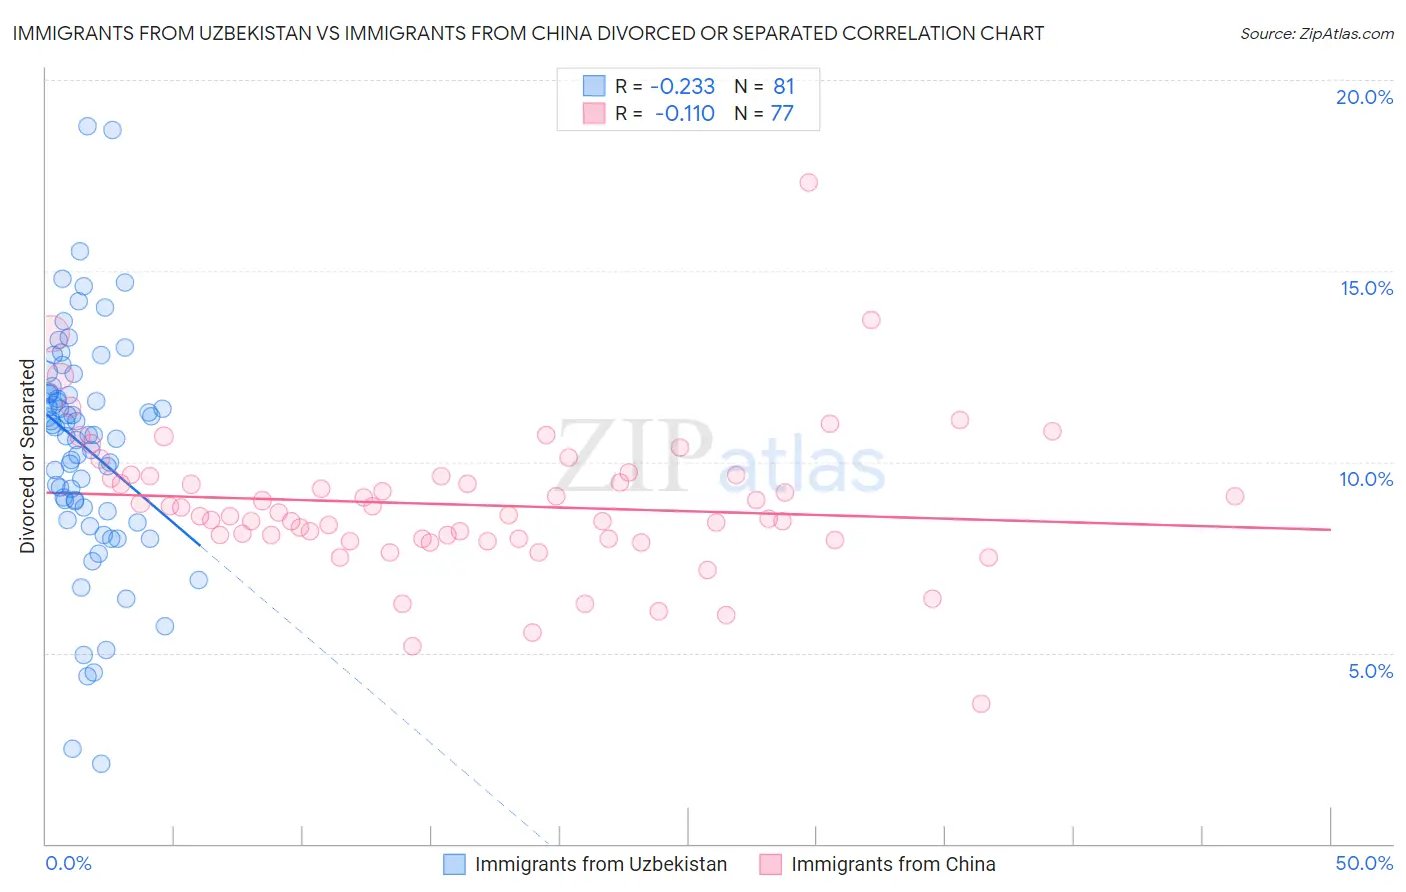
Immigrants from Uzbekistan vs Immigrants from China Divorced or Separated Correlation Chart
The statistical analysis conducted on geographies consisting of 118,737,303 people shows a weak negative correlation between the proportion of Immigrants from Uzbekistan and percentage of population currently divorced or separated in the United States with a correlation coefficient (R) of -0.233 and weighted average of 11.1%. Similarly, the statistical analysis conducted on geographies consisting of 456,716,224 people shows a poor negative correlation between the proportion of Immigrants from China and percentage of population currently divorced or separated in the United States with a correlation coefficient (R) of -0.110 and weighted average of 10.0%, a difference of 10.4%.
Divorced or Separated Correlation Summary
| Measurement | Immigrants from Uzbekistan | Immigrants from China |
| Minimum | 2.1% | 3.6% |
| Maximum | 18.8% | 17.3% |
| Range | 16.7% | 13.7% |
| Mean | 10.4% | 8.9% |
| Median | 10.7% | 8.6% |
| Interquartile 25% (IQ1) | 8.7% | 8.0% |
| Interquartile 75% (IQ3) | 11.8% | 9.6% |
| Interquartile Range (IQR) | 3.1% | 1.6% |
| Standard Deviation (Sample) | 3.0% | 1.9% |
| Standard Deviation (Population) | 3.0% | 1.9% |
Similar Demographics by Divorced or Separated
Demographics Similar to Immigrants from Uzbekistan by Divorced or Separated
In terms of divorced or separated, the demographic groups most similar to Immigrants from Uzbekistan are Egyptian (11.1%, a difference of 0.070%), Cambodian (11.1%, a difference of 0.080%), Tongan (11.1%, a difference of 0.12%), Immigrants from Japan (11.1%, a difference of 0.14%), and Immigrants from Lebanon (11.1%, a difference of 0.15%).
| Demographics | Rating | Rank | Divorced or Separated |
| Immigrants | Bangladesh | 100.0 /100 | #27 | Exceptional 11.0% |
| Immigrants | Malaysia | 100.0 /100 | #28 | Exceptional 11.0% |
| Armenians | 100.0 /100 | #29 | Exceptional 11.0% |
| Immigrants | Ireland | 100.0 /100 | #30 | Exceptional 11.0% |
| Mongolians | 100.0 /100 | #31 | Exceptional 11.1% |
| Tongans | 100.0 /100 | #32 | Exceptional 11.1% |
| Egyptians | 100.0 /100 | #33 | Exceptional 11.1% |
| Immigrants | Uzbekistan | 100.0 /100 | #34 | Exceptional 11.1% |
| Cambodians | 100.0 /100 | #35 | Exceptional 11.1% |
| Immigrants | Japan | 100.0 /100 | #36 | Exceptional 11.1% |
| Immigrants | Lebanon | 100.0 /100 | #37 | Exceptional 11.1% |
| Immigrants | Greece | 100.0 /100 | #38 | Exceptional 11.1% |
| Immigrants | Egypt | 100.0 /100 | #39 | Exceptional 11.1% |
| Soviet Union | 100.0 /100 | #40 | Exceptional 11.1% |
| Bhutanese | 100.0 /100 | #41 | Exceptional 11.2% |
Demographics Similar to Immigrants from China by Divorced or Separated
In terms of divorced or separated, the demographic groups most similar to Immigrants from China are Immigrants from India (10.1%, a difference of 0.23%), Immigrants from Hong Kong (10.0%, a difference of 0.72%), Filipino (9.9%, a difference of 1.3%), Indian (Asian) (10.2%, a difference of 1.6%), and Thai (10.2%, a difference of 1.6%).
| Demographics | Rating | Rank | Divorced or Separated |
| Immigrants | Taiwan | 100.0 /100 | #1 | Exceptional 9.8% |
| Filipinos | 100.0 /100 | #2 | Exceptional 9.9% |
| Immigrants | Hong Kong | 100.0 /100 | #3 | Exceptional 10.0% |
| Immigrants | China | 100.0 /100 | #4 | Exceptional 10.0% |
| Immigrants | India | 100.0 /100 | #5 | Exceptional 10.1% |
| Indians (Asian) | 100.0 /100 | #6 | Exceptional 10.2% |
| Thais | 100.0 /100 | #7 | Exceptional 10.2% |
| Immigrants | Eastern Asia | 100.0 /100 | #8 | Exceptional 10.2% |
| Yup'ik | 100.0 /100 | #9 | Exceptional 10.3% |
| Immigrants | Singapore | 100.0 /100 | #10 | Exceptional 10.3% |
| Immigrants | South Central Asia | 100.0 /100 | #11 | Exceptional 10.4% |
| Okinawans | 100.0 /100 | #12 | Exceptional 10.5% |
| Cypriots | 100.0 /100 | #13 | Exceptional 10.5% |
| Assyrians/Chaldeans/Syriacs | 100.0 /100 | #14 | Exceptional 10.6% |
| Immigrants | Armenia | 100.0 /100 | #15 | Exceptional 10.6% |