Immigrants from Dominican Republic vs Immigrants from China Divorced or Separated
COMPARE
Immigrants from Dominican Republic
Immigrants from China
Divorced or Separated
Divorced or Separated Comparison
Immigrants from Dominican Republic
Immigrants from China
12.7%
DIVORCED OR SEPARATED
0.2/ 100
METRIC RATING
279th/ 347
METRIC RANK
10.0%
DIVORCED OR SEPARATED
100.0/ 100
METRIC RATING
4th/ 347
METRIC RANK
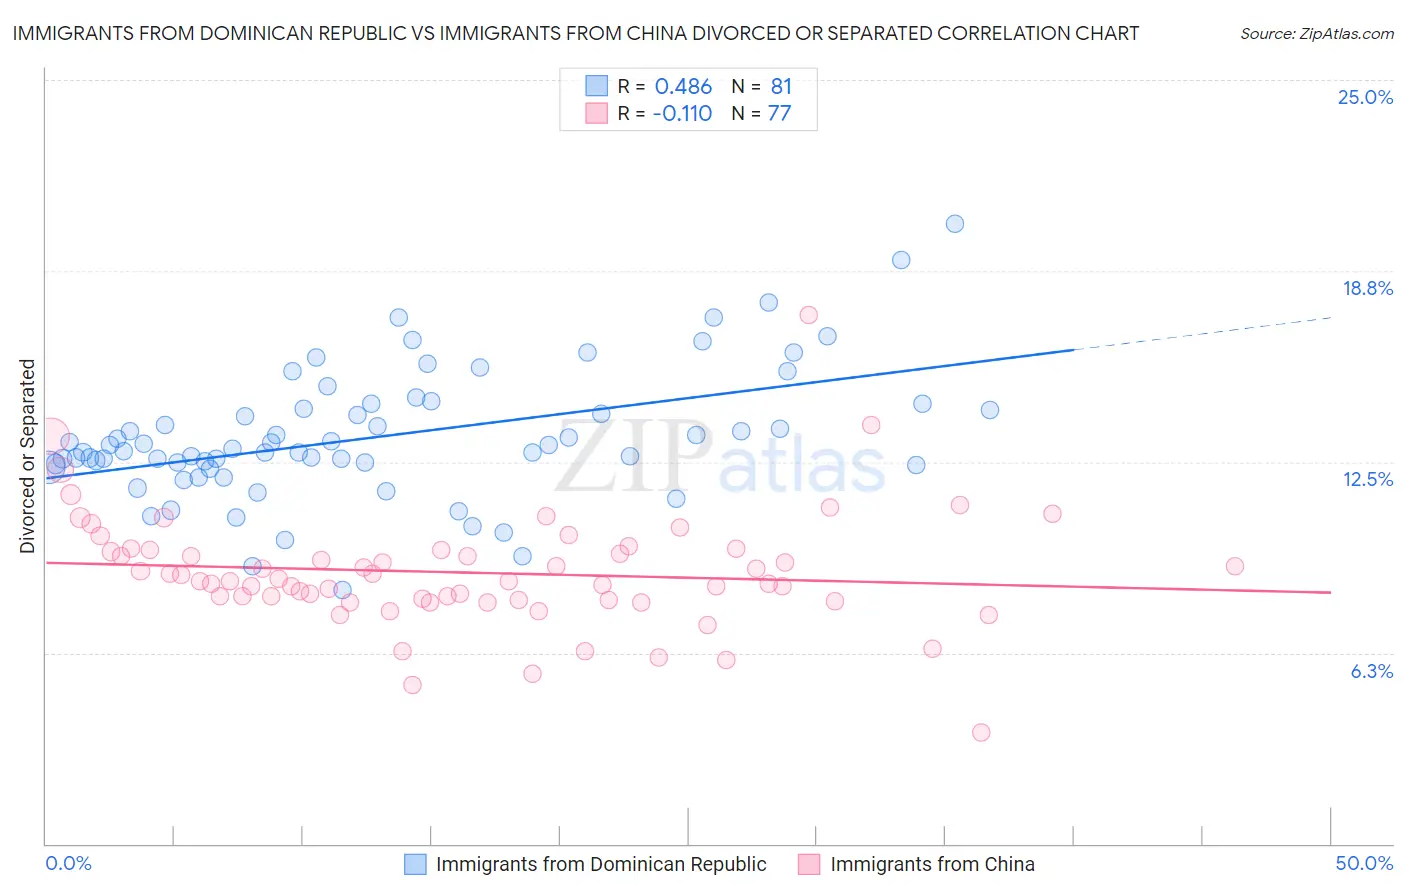
Immigrants from Dominican Republic vs Immigrants from China Divorced or Separated Correlation Chart
The statistical analysis conducted on geographies consisting of 275,019,044 people shows a moderate positive correlation between the proportion of Immigrants from Dominican Republic and percentage of population currently divorced or separated in the United States with a correlation coefficient (R) of 0.486 and weighted average of 12.7%. Similarly, the statistical analysis conducted on geographies consisting of 456,716,224 people shows a poor negative correlation between the proportion of Immigrants from China and percentage of population currently divorced or separated in the United States with a correlation coefficient (R) of -0.110 and weighted average of 10.0%, a difference of 26.6%.
Divorced or Separated Correlation Summary
| Measurement | Immigrants from Dominican Republic | Immigrants from China |
| Minimum | 8.3% | 3.6% |
| Maximum | 20.3% | 17.3% |
| Range | 12.0% | 13.7% |
| Mean | 13.3% | 8.9% |
| Median | 12.9% | 8.6% |
| Interquartile 25% (IQ1) | 12.4% | 8.0% |
| Interquartile 75% (IQ3) | 14.3% | 9.6% |
| Interquartile Range (IQR) | 1.9% | 1.6% |
| Standard Deviation (Sample) | 2.1% | 1.9% |
| Standard Deviation (Population) | 2.1% | 1.9% |
Similar Demographics by Divorced or Separated
Demographics Similar to Immigrants from Dominican Republic by Divorced or Separated
In terms of divorced or separated, the demographic groups most similar to Immigrants from Dominican Republic are Lumbee (12.7%, a difference of 0.010%), Immigrants from Zaire (12.7%, a difference of 0.070%), Pueblo (12.7%, a difference of 0.11%), Dominican (12.7%, a difference of 0.16%), and Spaniard (12.7%, a difference of 0.21%).
| Demographics | Rating | Rank | Divorced or Separated |
| Immigrants | Middle Africa | 0.3 /100 | #272 | Tragic 12.7% |
| Immigrants | Micronesia | 0.3 /100 | #273 | Tragic 12.7% |
| Bermudans | 0.3 /100 | #274 | Tragic 12.7% |
| Central American Indians | 0.3 /100 | #275 | Tragic 12.7% |
| Spaniards | 0.2 /100 | #276 | Tragic 12.7% |
| Dominicans | 0.2 /100 | #277 | Tragic 12.7% |
| Lumbee | 0.2 /100 | #278 | Tragic 12.7% |
| Immigrants | Dominican Republic | 0.2 /100 | #279 | Tragic 12.7% |
| Immigrants | Zaire | 0.2 /100 | #280 | Tragic 12.7% |
| Pueblo | 0.2 /100 | #281 | Tragic 12.7% |
| Sub-Saharan Africans | 0.1 /100 | #282 | Tragic 12.7% |
| Delaware | 0.1 /100 | #283 | Tragic 12.7% |
| Immigrants | Nonimmigrants | 0.1 /100 | #284 | Tragic 12.8% |
| French | 0.1 /100 | #285 | Tragic 12.8% |
| Spanish | 0.1 /100 | #286 | Tragic 12.8% |
Demographics Similar to Immigrants from China by Divorced or Separated
In terms of divorced or separated, the demographic groups most similar to Immigrants from China are Immigrants from India (10.1%, a difference of 0.23%), Immigrants from Hong Kong (10.0%, a difference of 0.72%), Filipino (9.9%, a difference of 1.3%), Indian (Asian) (10.2%, a difference of 1.6%), and Thai (10.2%, a difference of 1.6%).
| Demographics | Rating | Rank | Divorced or Separated |
| Immigrants | Taiwan | 100.0 /100 | #1 | Exceptional 9.8% |
| Filipinos | 100.0 /100 | #2 | Exceptional 9.9% |
| Immigrants | Hong Kong | 100.0 /100 | #3 | Exceptional 10.0% |
| Immigrants | China | 100.0 /100 | #4 | Exceptional 10.0% |
| Immigrants | India | 100.0 /100 | #5 | Exceptional 10.1% |
| Indians (Asian) | 100.0 /100 | #6 | Exceptional 10.2% |
| Thais | 100.0 /100 | #7 | Exceptional 10.2% |
| Immigrants | Eastern Asia | 100.0 /100 | #8 | Exceptional 10.2% |
| Yup'ik | 100.0 /100 | #9 | Exceptional 10.3% |
| Immigrants | Singapore | 100.0 /100 | #10 | Exceptional 10.3% |
| Immigrants | South Central Asia | 100.0 /100 | #11 | Exceptional 10.4% |
| Okinawans | 100.0 /100 | #12 | Exceptional 10.5% |
| Cypriots | 100.0 /100 | #13 | Exceptional 10.5% |
| Assyrians/Chaldeans/Syriacs | 100.0 /100 | #14 | Exceptional 10.6% |
| Immigrants | Armenia | 100.0 /100 | #15 | Exceptional 10.6% |