Mexican American Indian vs Immigrants from the Azores Single Mother Households
COMPARE
Mexican American Indian
Immigrants from the Azores
Single Mother Households
Single Mother Households Comparison
Mexican American Indians
Immigrants from the Azores
7.4%
SINGLE MOTHER HOUSEHOLDS
0.2/ 100
METRIC RATING
255th/ 347
METRIC RANK
7.5%
SINGLE MOTHER HOUSEHOLDS
0.1/ 100
METRIC RATING
272nd/ 347
METRIC RANK
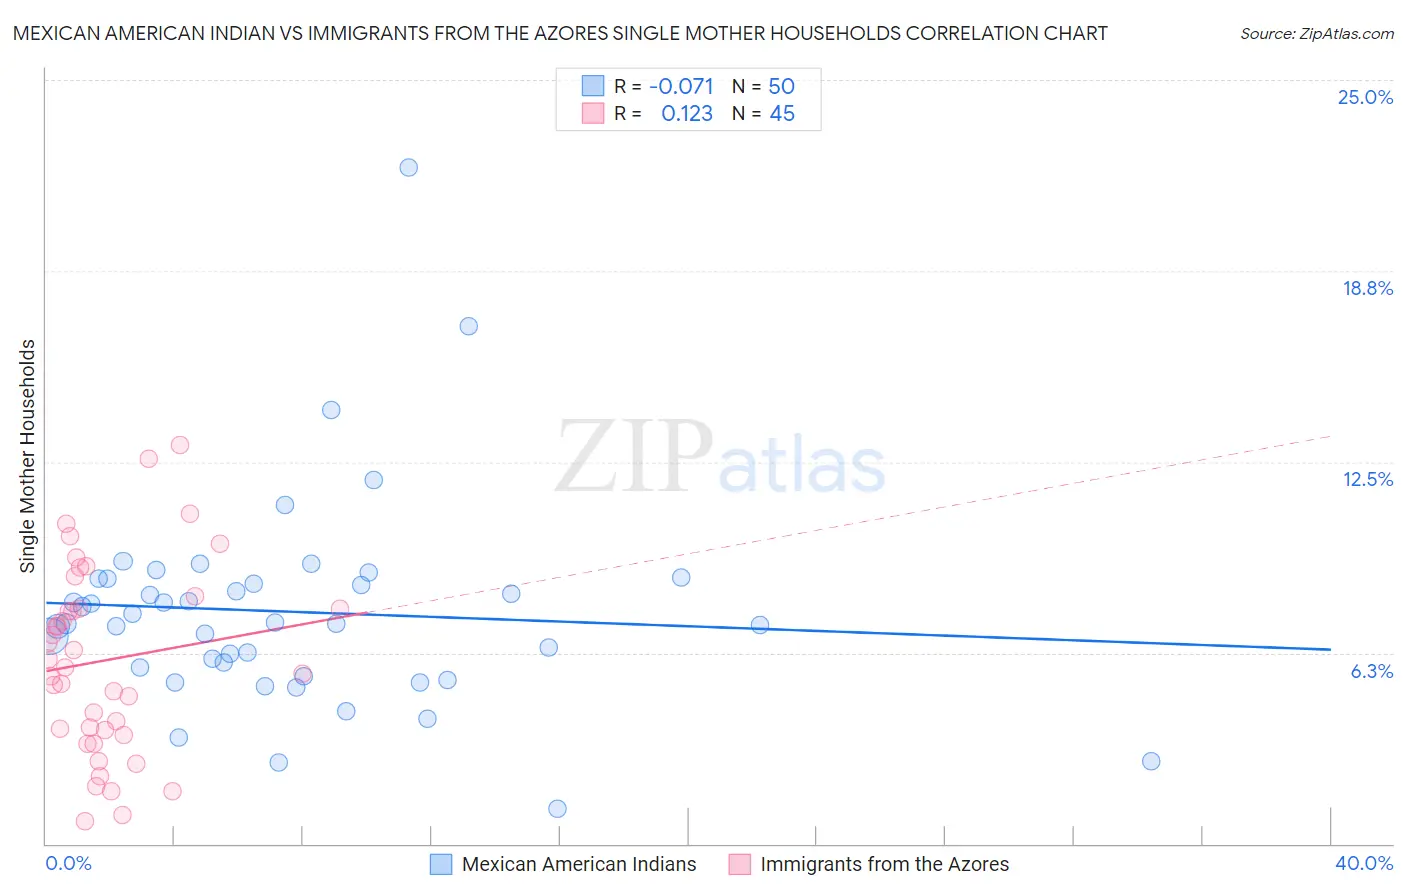
Mexican American Indian vs Immigrants from the Azores Single Mother Households Correlation Chart
The statistical analysis conducted on geographies consisting of 317,232,303 people shows a slight negative correlation between the proportion of Mexican American Indians and percentage of single mother households in the United States with a correlation coefficient (R) of -0.071 and weighted average of 7.4%. Similarly, the statistical analysis conducted on geographies consisting of 46,218,711 people shows a poor positive correlation between the proportion of Immigrants from the Azores and percentage of single mother households in the United States with a correlation coefficient (R) of 0.123 and weighted average of 7.5%, a difference of 2.3%.
Single Mother Households Correlation Summary
| Measurement | Mexican American Indian | Immigrants from the Azores |
| Minimum | 1.1% | 0.74% |
| Maximum | 22.1% | 13.1% |
| Range | 21.0% | 12.3% |
| Mean | 7.6% | 6.0% |
| Median | 7.2% | 5.8% |
| Interquartile 25% (IQ1) | 5.8% | 3.6% |
| Interquartile 75% (IQ3) | 8.7% | 7.9% |
| Interquartile Range (IQR) | 2.9% | 4.3% |
| Standard Deviation (Sample) | 3.4% | 3.1% |
| Standard Deviation (Population) | 3.4% | 3.0% |
Demographics Similar to Mexican American Indians and Immigrants from the Azores by Single Mother Households
In terms of single mother households, the demographic groups most similar to Mexican American Indians are Seminole (7.4%, a difference of 0.36%), Immigrants from Ecuador (7.3%, a difference of 0.37%), Alaska Native (7.4%, a difference of 0.40%), Cajun (7.3%, a difference of 0.42%), and Pueblo (7.4%, a difference of 0.42%). Similarly, the demographic groups most similar to Immigrants from the Azores are Salvadoran (7.5%, a difference of 0.0%), Immigrants from Cuba (7.5%, a difference of 0.090%), Somali (7.5%, a difference of 0.25%), Belizean (7.6%, a difference of 0.31%), and Indonesian (7.5%, a difference of 0.67%).
| Demographics | Rating | Rank | Single Mother Households |
| Cajuns | 0.3 /100 | #253 | Tragic 7.3% |
| Immigrants | Ecuador | 0.3 /100 | #254 | Tragic 7.3% |
| Mexican American Indians | 0.2 /100 | #255 | Tragic 7.4% |
| Seminole | 0.2 /100 | #256 | Tragic 7.4% |
| Alaska Natives | 0.2 /100 | #257 | Tragic 7.4% |
| Pueblo | 0.2 /100 | #258 | Tragic 7.4% |
| Immigrants | Yemen | 0.2 /100 | #259 | Tragic 7.4% |
| Immigrants | Zaire | 0.2 /100 | #260 | Tragic 7.4% |
| Japanese | 0.2 /100 | #261 | Tragic 7.4% |
| Immigrants | Somalia | 0.2 /100 | #262 | Tragic 7.4% |
| Immigrants | Nicaragua | 0.2 /100 | #263 | Tragic 7.4% |
| Yaqui | 0.1 /100 | #264 | Tragic 7.4% |
| Crow | 0.1 /100 | #265 | Tragic 7.4% |
| Nepalese | 0.1 /100 | #266 | Tragic 7.5% |
| Blackfeet | 0.1 /100 | #267 | Tragic 7.5% |
| Indonesians | 0.1 /100 | #268 | Tragic 7.5% |
| Somalis | 0.1 /100 | #269 | Tragic 7.5% |
| Immigrants | Cuba | 0.1 /100 | #270 | Tragic 7.5% |
| Salvadorans | 0.1 /100 | #271 | Tragic 7.5% |
| Immigrants | Azores | 0.1 /100 | #272 | Tragic 7.5% |
| Belizeans | 0.1 /100 | #273 | Tragic 7.6% |