Norwegian vs Spanish American Currently Married
COMPARE
Norwegian
Spanish American
Currently Married
Currently Married Comparison
Norwegians
Spanish Americans
50.2%
CURRENTLY MARRIED
100.0/ 100
METRIC RATING
6th/ 347
METRIC RANK
45.0%
CURRENTLY MARRIED
2.1/ 100
METRIC RATING
227th/ 347
METRIC RANK
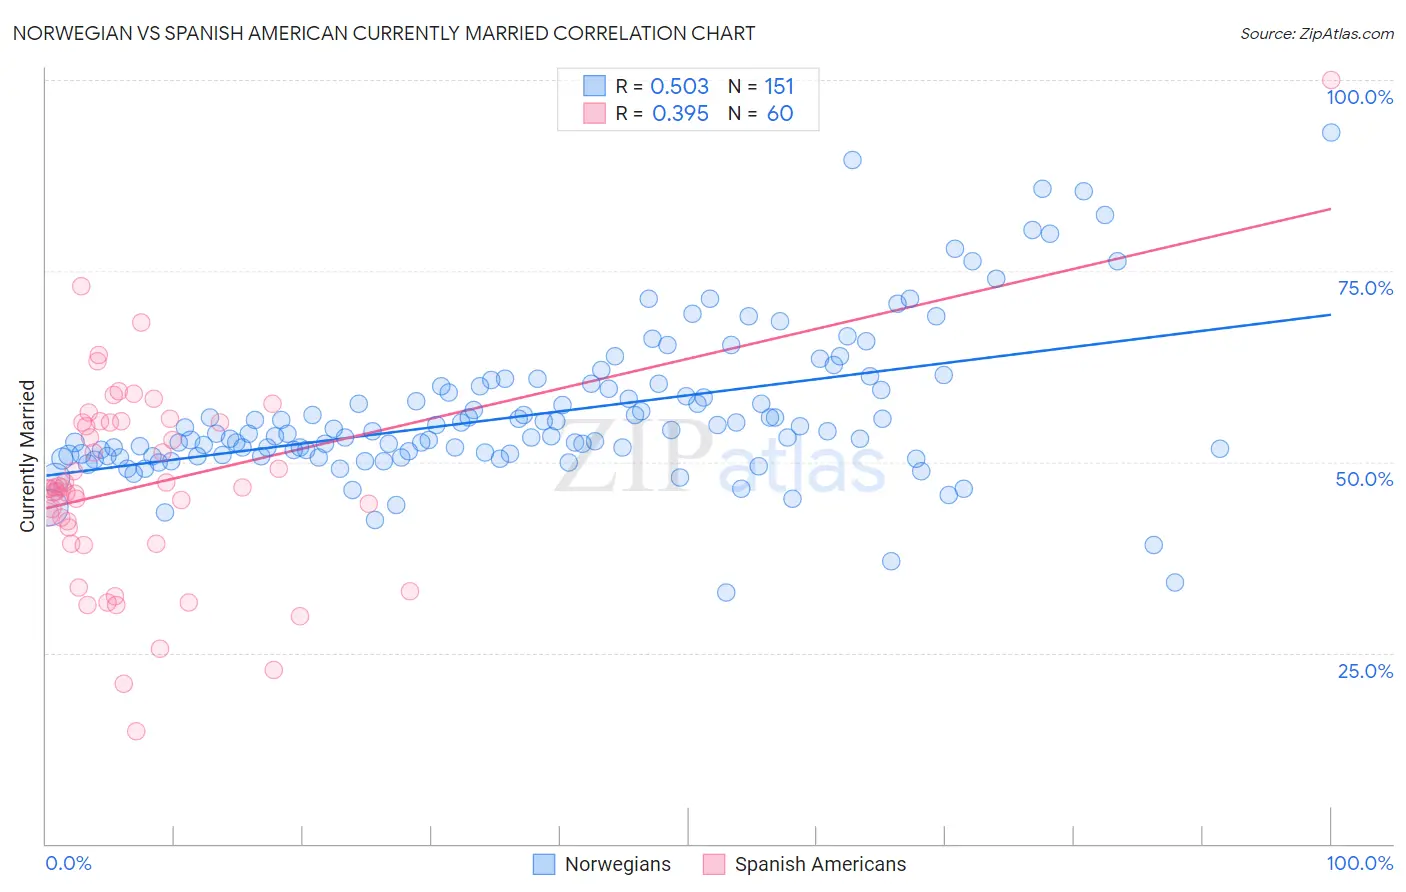
Norwegian vs Spanish American Currently Married Correlation Chart
The statistical analysis conducted on geographies consisting of 533,299,404 people shows a substantial positive correlation between the proportion of Norwegians and percentage of population currently married in the United States with a correlation coefficient (R) of 0.503 and weighted average of 50.2%. Similarly, the statistical analysis conducted on geographies consisting of 103,168,407 people shows a mild positive correlation between the proportion of Spanish Americans and percentage of population currently married in the United States with a correlation coefficient (R) of 0.395 and weighted average of 45.0%, a difference of 11.6%.
Currently Married Correlation Summary
| Measurement | Norwegian | Spanish American |
| Minimum | 32.9% | 14.8% |
| Maximum | 93.0% | 100.0% |
| Range | 60.2% | 85.2% |
| Mean | 56.4% | 47.0% |
| Median | 53.7% | 46.6% |
| Interquartile 25% (IQ1) | 50.8% | 40.4% |
| Interquartile 75% (IQ3) | 59.9% | 55.2% |
| Interquartile Range (IQR) | 9.1% | 14.8% |
| Standard Deviation (Sample) | 9.9% | 13.5% |
| Standard Deviation (Population) | 9.8% | 13.4% |
Similar Demographics by Currently Married
Demographics Similar to Norwegians by Currently Married
In terms of currently married, the demographic groups most similar to Norwegians are Immigrants from South Central Asia (50.0%, a difference of 0.34%), Swedish (50.0%, a difference of 0.47%), Danish (50.5%, a difference of 0.54%), Czech (49.9%, a difference of 0.66%), and Filipino (49.7%, a difference of 0.92%).
| Demographics | Rating | Rank | Currently Married |
| Immigrants | India | 100.0 /100 | #1 | Exceptional 51.8% |
| Thais | 100.0 /100 | #2 | Exceptional 50.9% |
| Assyrians/Chaldeans/Syriacs | 100.0 /100 | #3 | Exceptional 50.8% |
| Immigrants | Taiwan | 100.0 /100 | #4 | Exceptional 50.7% |
| Danes | 100.0 /100 | #5 | Exceptional 50.5% |
| Norwegians | 100.0 /100 | #6 | Exceptional 50.2% |
| Immigrants | South Central Asia | 100.0 /100 | #7 | Exceptional 50.0% |
| Swedes | 100.0 /100 | #8 | Exceptional 50.0% |
| Czechs | 99.9 /100 | #9 | Exceptional 49.9% |
| Filipinos | 99.9 /100 | #10 | Exceptional 49.7% |
| English | 99.9 /100 | #11 | Exceptional 49.7% |
| Swiss | 99.9 /100 | #12 | Exceptional 49.7% |
| Dutch | 99.9 /100 | #13 | Exceptional 49.6% |
| Germans | 99.9 /100 | #14 | Exceptional 49.6% |
| Pennsylvania Germans | 99.9 /100 | #15 | Exceptional 49.6% |
Demographics Similar to Spanish Americans by Currently Married
In terms of currently married, the demographic groups most similar to Spanish Americans are Comanche (45.0%, a difference of 0.0%), Immigrants from Uruguay (45.0%, a difference of 0.0%), French American Indian (45.0%, a difference of 0.050%), Immigrants from Uganda (45.0%, a difference of 0.060%), and Immigrants from Laos (45.0%, a difference of 0.10%).
| Demographics | Rating | Rank | Currently Married |
| Kenyans | 3.1 /100 | #220 | Tragic 45.2% |
| Mexicans | 3.0 /100 | #221 | Tragic 45.2% |
| Immigrants | Azores | 2.5 /100 | #222 | Tragic 45.1% |
| Immigrants | Laos | 2.3 /100 | #223 | Tragic 45.0% |
| Immigrants | Uganda | 2.2 /100 | #224 | Tragic 45.0% |
| French American Indians | 2.2 /100 | #225 | Tragic 45.0% |
| Comanche | 2.1 /100 | #226 | Tragic 45.0% |
| Spanish Americans | 2.1 /100 | #227 | Tragic 45.0% |
| Immigrants | Uruguay | 2.0 /100 | #228 | Tragic 45.0% |
| Cree | 1.7 /100 | #229 | Tragic 44.9% |
| Immigrants | Kenya | 1.6 /100 | #230 | Tragic 44.9% |
| Immigrants | Panama | 1.5 /100 | #231 | Tragic 44.9% |
| Nepalese | 1.2 /100 | #232 | Tragic 44.7% |
| Immigrants | Saudi Arabia | 1.1 /100 | #233 | Tragic 44.7% |
| Iroquois | 1.1 /100 | #234 | Tragic 44.7% |