Norwegian vs Apache High School Diploma
COMPARE
Norwegian
Apache
High School Diploma
High School Diploma Comparison
Norwegians
Apache
92.5%
HIGH SCHOOL DIPLOMA
100.0/ 100
METRIC RATING
1st/ 347
METRIC RANK
85.1%
HIGH SCHOOL DIPLOMA
0.0/ 100
METRIC RATING
310th/ 347
METRIC RANK
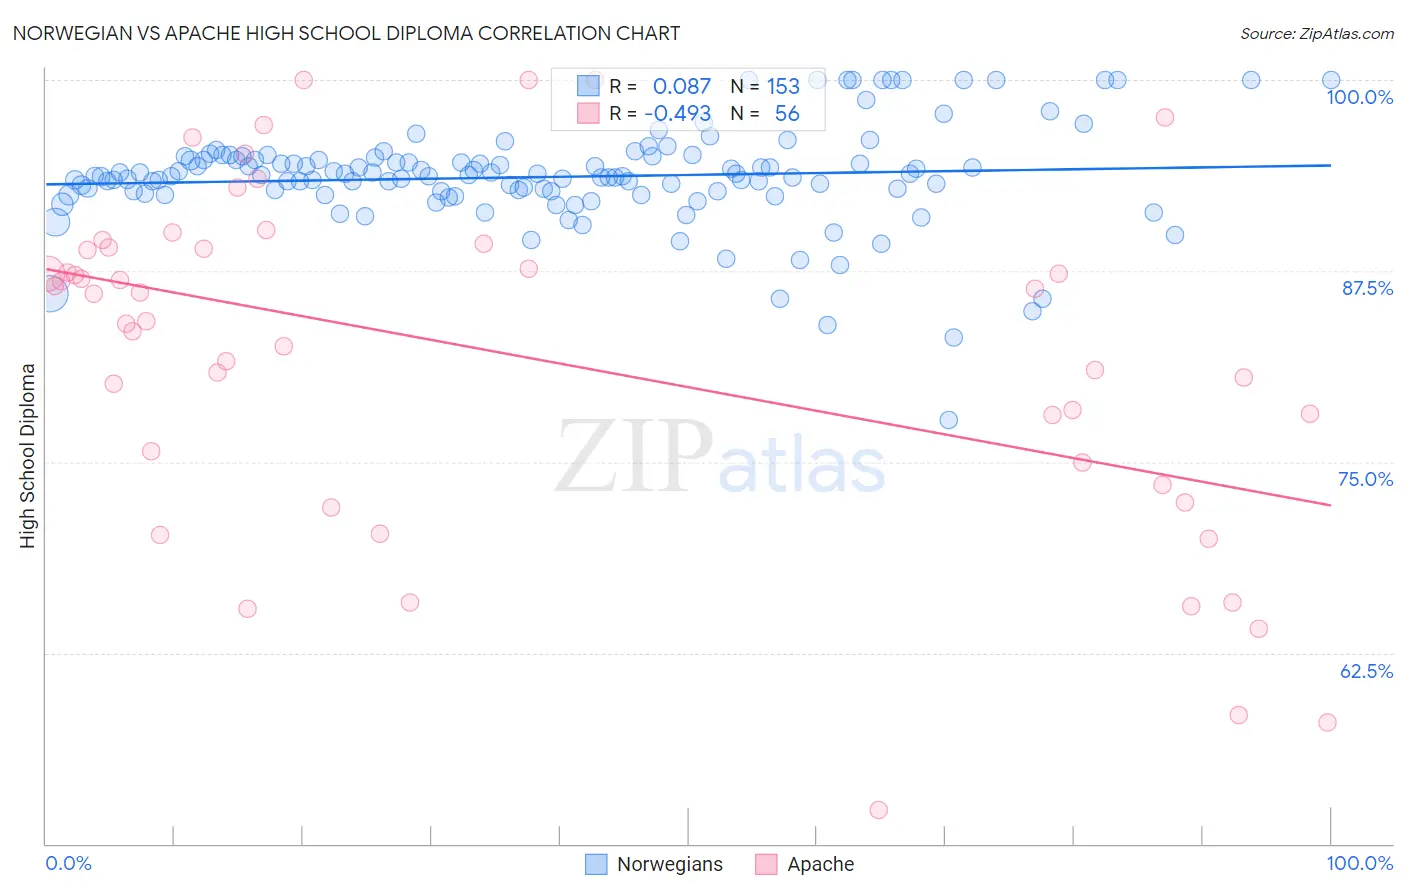
Norwegian vs Apache High School Diploma Correlation Chart
The statistical analysis conducted on geographies consisting of 533,395,571 people shows a slight positive correlation between the proportion of Norwegians and percentage of population with at least high school diploma education in the United States with a correlation coefficient (R) of 0.087 and weighted average of 92.5%. Similarly, the statistical analysis conducted on geographies consisting of 231,143,094 people shows a moderate negative correlation between the proportion of Apache and percentage of population with at least high school diploma education in the United States with a correlation coefficient (R) of -0.493 and weighted average of 85.1%, a difference of 8.7%.
High School Diploma Correlation Summary
| Measurement | Norwegian | Apache |
| Minimum | 77.8% | 52.2% |
| Maximum | 100.0% | 100.0% |
| Range | 22.2% | 47.8% |
| Mean | 93.7% | 81.9% |
| Median | 93.7% | 85.1% |
| Interquartile 25% (IQ1) | 92.7% | 74.2% |
| Interquartile 75% (IQ3) | 94.9% | 89.0% |
| Interquartile Range (IQR) | 2.2% | 14.8% |
| Standard Deviation (Sample) | 3.3% | 11.3% |
| Standard Deviation (Population) | 3.3% | 11.2% |
Similar Demographics by High School Diploma
Demographics Similar to Norwegians by High School Diploma
In terms of high school diploma, the demographic groups most similar to Norwegians are Swedish (92.2%, a difference of 0.33%), Carpatho Rusyn (92.1%, a difference of 0.43%), Lithuanian (92.0%, a difference of 0.49%), Slovene (92.0%, a difference of 0.49%), and Slovak (92.0%, a difference of 0.51%).
| Demographics | Rating | Rank | High School Diploma |
| Norwegians | 100.0 /100 | #1 | Exceptional 92.5% |
| Swedes | 100.0 /100 | #2 | Exceptional 92.2% |
| Carpatho Rusyns | 100.0 /100 | #3 | Exceptional 92.1% |
| Lithuanians | 100.0 /100 | #4 | Exceptional 92.0% |
| Slovenes | 100.0 /100 | #5 | Exceptional 92.0% |
| Slovaks | 100.0 /100 | #6 | Exceptional 92.0% |
| Immigrants | India | 100.0 /100 | #7 | Exceptional 92.0% |
| Chinese | 100.0 /100 | #8 | Exceptional 92.0% |
| Latvians | 100.0 /100 | #9 | Exceptional 92.0% |
| Croatians | 100.0 /100 | #10 | Exceptional 92.0% |
| Eastern Europeans | 100.0 /100 | #11 | Exceptional 91.9% |
| Poles | 100.0 /100 | #12 | Exceptional 91.9% |
| Danes | 100.0 /100 | #13 | Exceptional 91.8% |
| Bulgarians | 100.0 /100 | #14 | Exceptional 91.8% |
| Luxembourgers | 100.0 /100 | #15 | Exceptional 91.7% |
Demographics Similar to Apache by High School Diploma
In terms of high school diploma, the demographic groups most similar to Apache are Ecuadorian (85.1%, a difference of 0.010%), Cape Verdean (85.1%, a difference of 0.060%), Immigrants from Dominica (85.2%, a difference of 0.080%), Immigrants from Armenia (85.2%, a difference of 0.090%), and Navajo (85.2%, a difference of 0.10%).
| Demographics | Rating | Rank | High School Diploma |
| Cubans | 0.0 /100 | #303 | Tragic 85.4% |
| Nepalese | 0.0 /100 | #304 | Tragic 85.3% |
| Immigrants | Portugal | 0.0 /100 | #305 | Tragic 85.3% |
| Immigrants | Guyana | 0.0 /100 | #306 | Tragic 85.3% |
| Navajo | 0.0 /100 | #307 | Tragic 85.2% |
| Immigrants | Armenia | 0.0 /100 | #308 | Tragic 85.2% |
| Immigrants | Dominica | 0.0 /100 | #309 | Tragic 85.2% |
| Apache | 0.0 /100 | #310 | Tragic 85.1% |
| Ecuadorians | 0.0 /100 | #311 | Tragic 85.1% |
| Cape Verdeans | 0.0 /100 | #312 | Tragic 85.1% |
| Immigrants | Ecuador | 0.0 /100 | #313 | Tragic 84.8% |
| Yaqui | 0.0 /100 | #314 | Tragic 84.7% |
| Puerto Ricans | 0.0 /100 | #315 | Tragic 84.7% |
| Belizeans | 0.0 /100 | #316 | Tragic 84.3% |
| Immigrants | Caribbean | 0.0 /100 | #317 | Tragic 84.3% |