Irish vs Sri Lankan Average Family Size
COMPARE
Irish
Sri Lankan
Average Family Size
Average Family Size Comparison
Irish
Sri Lankans
3.10
AVERAGE FAMILY SIZE
0.0/ 100
METRIC RATING
336th/ 347
METRIC RANK
3.35
AVERAGE FAMILY SIZE
100.0/ 100
METRIC RATING
57th/ 347
METRIC RANK
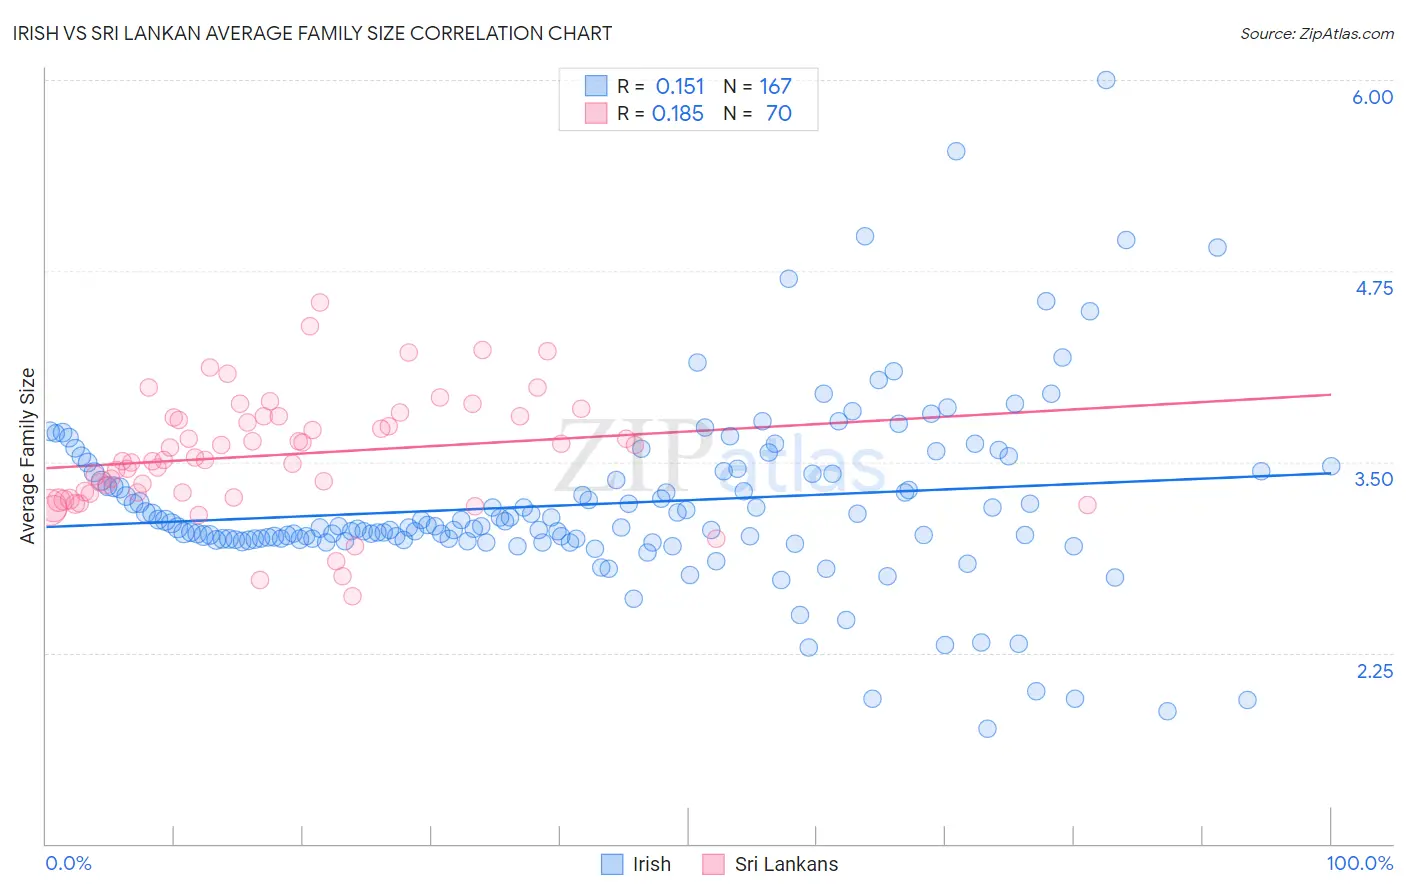
Irish vs Sri Lankan Average Family Size Correlation Chart
The statistical analysis conducted on geographies consisting of 580,016,096 people shows a poor positive correlation between the proportion of Irish and average family size in the United States with a correlation coefficient (R) of 0.151 and weighted average of 3.10. Similarly, the statistical analysis conducted on geographies consisting of 440,097,378 people shows a poor positive correlation between the proportion of Sri Lankans and average family size in the United States with a correlation coefficient (R) of 0.185 and weighted average of 3.35, a difference of 8.1%.
Average Family Size Correlation Summary
| Measurement | Irish | Sri Lankan |
| Minimum | 1.75 | 2.62 |
| Maximum | 6.00 | 4.54 |
| Range | 4.25 | 1.92 |
| Mean | 3.22 | 3.55 |
| Median | 3.08 | 3.51 |
| Interquartile 25% (IQ1) | 2.99 | 3.29 |
| Interquartile 75% (IQ3) | 3.43 | 3.80 |
| Interquartile Range (IQR) | 0.44 | 0.51 |
| Standard Deviation (Sample) | 0.59 | 0.38 |
| Standard Deviation (Population) | 0.59 | 0.38 |
Similar Demographics by Average Family Size
Demographics Similar to Irish by Average Family Size
In terms of average family size, the demographic groups most similar to Irish are Swedish (3.10, a difference of 0.030%), Luxembourger (3.10, a difference of 0.060%), French (3.10, a difference of 0.060%), Croatian (3.10, a difference of 0.070%), and Estonian (3.10, a difference of 0.090%).
| Demographics | Rating | Rank | Average Family Size |
| Belgians | 0.0 /100 | #329 | Tragic 3.11 |
| Latvians | 0.0 /100 | #330 | Tragic 3.11 |
| Scotch-Irish | 0.0 /100 | #331 | Tragic 3.11 |
| Scottish | 0.0 /100 | #332 | Tragic 3.11 |
| Estonians | 0.0 /100 | #333 | Tragic 3.10 |
| Lithuanians | 0.0 /100 | #334 | Tragic 3.10 |
| Luxembourgers | 0.0 /100 | #335 | Tragic 3.10 |
| Irish | 0.0 /100 | #336 | Tragic 3.10 |
| Swedes | 0.0 /100 | #337 | Tragic 3.10 |
| French | 0.0 /100 | #338 | Tragic 3.10 |
| Croatians | 0.0 /100 | #339 | Tragic 3.10 |
| Finns | 0.0 /100 | #340 | Tragic 3.09 |
| Poles | 0.0 /100 | #341 | Tragic 3.09 |
| Germans | 0.0 /100 | #342 | Tragic 3.09 |
| Norwegians | 0.0 /100 | #343 | Tragic 3.08 |
Demographics Similar to Sri Lankans by Average Family Size
In terms of average family size, the demographic groups most similar to Sri Lankans are Honduran (3.35, a difference of 0.010%), Immigrants from Dominican Republic (3.35, a difference of 0.060%), Japanese (3.35, a difference of 0.10%), Immigrants from Honduras (3.36, a difference of 0.12%), and Immigrants from Armenia (3.35, a difference of 0.12%).
| Demographics | Rating | Rank | Average Family Size |
| Immigrants | Bangladesh | 100.0 /100 | #50 | Exceptional 3.36 |
| Nicaraguans | 100.0 /100 | #51 | Exceptional 3.36 |
| Fijians | 100.0 /100 | #52 | Exceptional 3.36 |
| Koreans | 100.0 /100 | #53 | Exceptional 3.36 |
| Immigrants | South Eastern Asia | 100.0 /100 | #54 | Exceptional 3.36 |
| Immigrants | Honduras | 100.0 /100 | #55 | Exceptional 3.36 |
| Immigrants | Dominican Republic | 100.0 /100 | #56 | Exceptional 3.35 |
| Sri Lankans | 100.0 /100 | #57 | Exceptional 3.35 |
| Hondurans | 100.0 /100 | #58 | Exceptional 3.35 |
| Japanese | 100.0 /100 | #59 | Exceptional 3.35 |
| Immigrants | Armenia | 100.0 /100 | #60 | Exceptional 3.35 |
| Central American Indians | 100.0 /100 | #61 | Exceptional 3.35 |
| Immigrants | Grenada | 100.0 /100 | #62 | Exceptional 3.34 |
| Chinese | 100.0 /100 | #63 | Exceptional 3.34 |
| Dominicans | 99.9 /100 | #64 | Exceptional 3.34 |