Nigerian vs Pima Single Father Households
COMPARE
Nigerian
Pima
Single Father Households
Single Father Households Comparison
Nigerians
Pima
2.4%
SINGLE FATHER HOUSEHOLDS
41.0/ 100
METRIC RATING
185th/ 347
METRIC RANK
4.2%
SINGLE FATHER HOUSEHOLDS
0.0/ 100
METRIC RATING
343rd/ 347
METRIC RANK
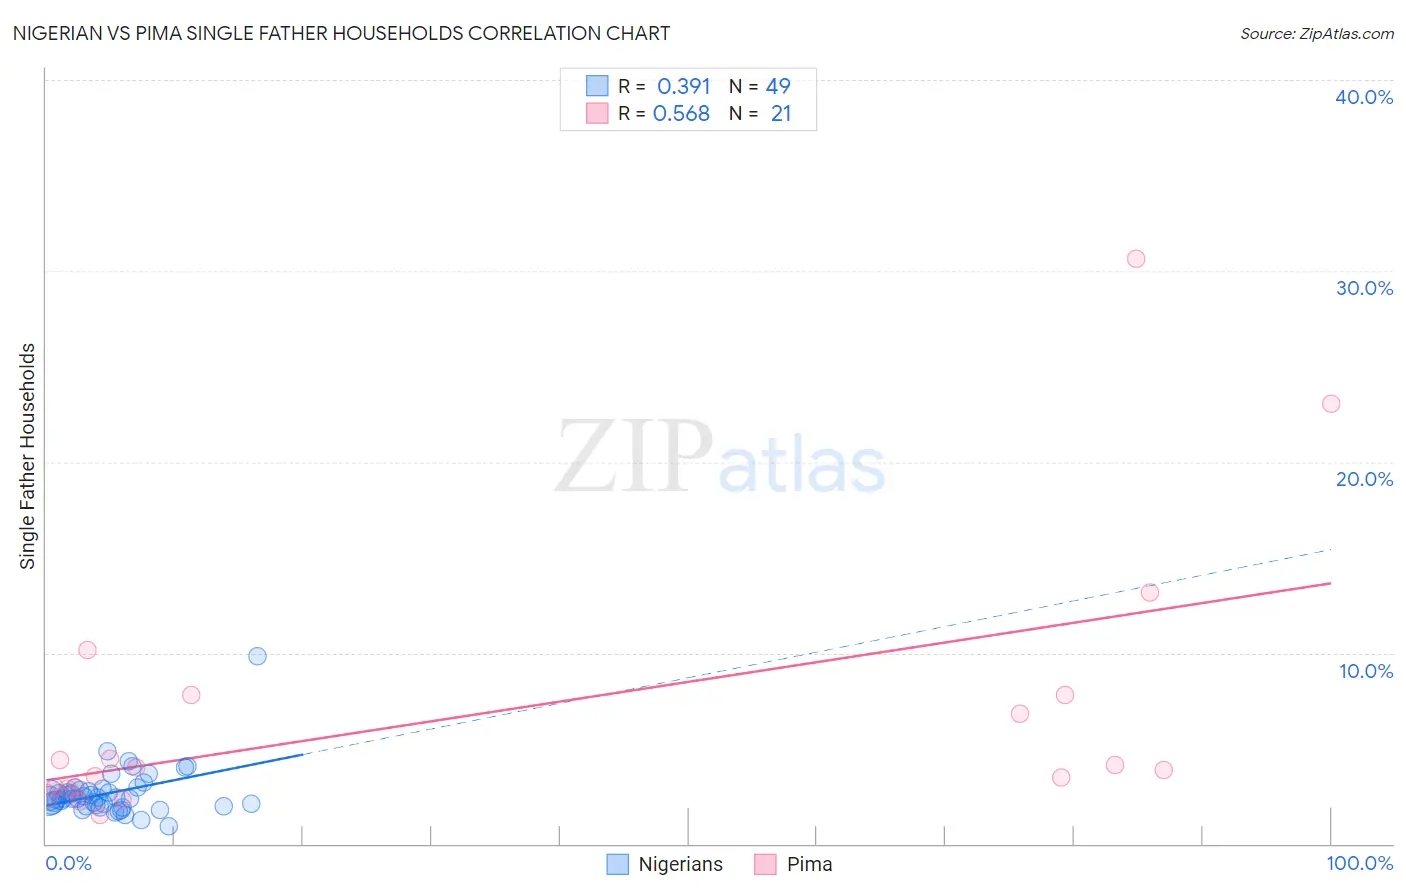
Nigerian vs Pima Single Father Households Correlation Chart
The statistical analysis conducted on geographies consisting of 330,825,624 people shows a mild positive correlation between the proportion of Nigerians and percentage of single father households in the United States with a correlation coefficient (R) of 0.391 and weighted average of 2.4%. Similarly, the statistical analysis conducted on geographies consisting of 61,336,251 people shows a substantial positive correlation between the proportion of Pima and percentage of single father households in the United States with a correlation coefficient (R) of 0.568 and weighted average of 4.2%, a difference of 77.4%.
Single Father Households Correlation Summary
| Measurement | Nigerian | Pima |
| Minimum | 0.90% | 1.5% |
| Maximum | 9.8% | 30.6% |
| Range | 8.9% | 29.1% |
| Mean | 2.7% | 6.9% |
| Median | 2.4% | 4.0% |
| Interquartile 25% (IQ1) | 2.0% | 2.9% |
| Interquartile 75% (IQ3) | 2.8% | 7.8% |
| Interquartile Range (IQR) | 0.85% | 4.9% |
| Standard Deviation (Sample) | 1.3% | 7.3% |
| Standard Deviation (Population) | 1.3% | 7.2% |
Similar Demographics by Single Father Households
Demographics Similar to Nigerians by Single Father Households
In terms of single father households, the demographic groups most similar to Nigerians are Immigrants from Bosnia and Herzegovina (2.4%, a difference of 0.050%), Immigrants from Panama (2.4%, a difference of 0.060%), Sri Lankan (2.4%, a difference of 0.060%), Belgian (2.3%, a difference of 0.17%), and Jamaican (2.3%, a difference of 0.18%).
| Demographics | Rating | Rank | Single Father Households |
| Costa Ricans | 44.1 /100 | #178 | Average 2.3% |
| Welsh | 44.0 /100 | #179 | Average 2.3% |
| Yugoslavians | 43.9 /100 | #180 | Average 2.3% |
| Jamaicans | 43.5 /100 | #181 | Average 2.3% |
| Belgians | 43.3 /100 | #182 | Average 2.3% |
| Immigrants | Panama | 41.8 /100 | #183 | Average 2.4% |
| Sri Lankans | 41.8 /100 | #184 | Average 2.4% |
| Nigerians | 41.0 /100 | #185 | Average 2.4% |
| Immigrants | Bosnia and Herzegovina | 40.4 /100 | #186 | Average 2.4% |
| Immigrants | Colombia | 34.0 /100 | #187 | Fair 2.4% |
| Hmong | 33.0 /100 | #188 | Fair 2.4% |
| U.S. Virgin Islanders | 31.8 /100 | #189 | Fair 2.4% |
| French | 31.7 /100 | #190 | Fair 2.4% |
| Immigrants | Africa | 30.0 /100 | #191 | Fair 2.4% |
| Immigrants | Sudan | 29.8 /100 | #192 | Fair 2.4% |
Demographics Similar to Pima by Single Father Households
In terms of single father households, the demographic groups most similar to Pima are Yakama (4.2%, a difference of 0.24%), Menominee (4.2%, a difference of 0.93%), Tohono O'odham (3.8%, a difference of 9.2%), Inupiat (4.9%, a difference of 16.4%), and Crow (3.5%, a difference of 18.8%).
| Demographics | Rating | Rank | Single Father Households |
| Natives/Alaskans | 0.0 /100 | #333 | Tragic 3.2% |
| Yuman | 0.0 /100 | #334 | Tragic 3.3% |
| Colville | 0.0 /100 | #335 | Tragic 3.3% |
| Paiute | 0.0 /100 | #336 | Tragic 3.3% |
| Pueblo | 0.0 /100 | #337 | Tragic 3.3% |
| Sioux | 0.0 /100 | #338 | Tragic 3.3% |
| Alaskan Athabascans | 0.0 /100 | #339 | Tragic 3.4% |
| Alaska Natives | 0.0 /100 | #340 | Tragic 3.5% |
| Crow | 0.0 /100 | #341 | Tragic 3.5% |
| Tohono O'odham | 0.0 /100 | #342 | Tragic 3.8% |
| Pima | 0.0 /100 | #343 | Tragic 4.2% |
| Yakama | 0.0 /100 | #344 | Tragic 4.2% |
| Menominee | 0.0 /100 | #345 | Tragic 4.2% |
| Inupiat | 0.0 /100 | #346 | Tragic 4.9% |
| Yup'ik | 0.0 /100 | #347 | Tragic 5.4% |