Carpatho Rusyn vs Pima Single Father Households
COMPARE
Carpatho Rusyn
Pima
Single Father Households
Single Father Households Comparison
Carpatho Rusyns
Pima
2.1%
SINGLE FATHER HOUSEHOLDS
99.6/ 100
METRIC RATING
84th/ 347
METRIC RANK
4.2%
SINGLE FATHER HOUSEHOLDS
0.0/ 100
METRIC RATING
343rd/ 347
METRIC RANK
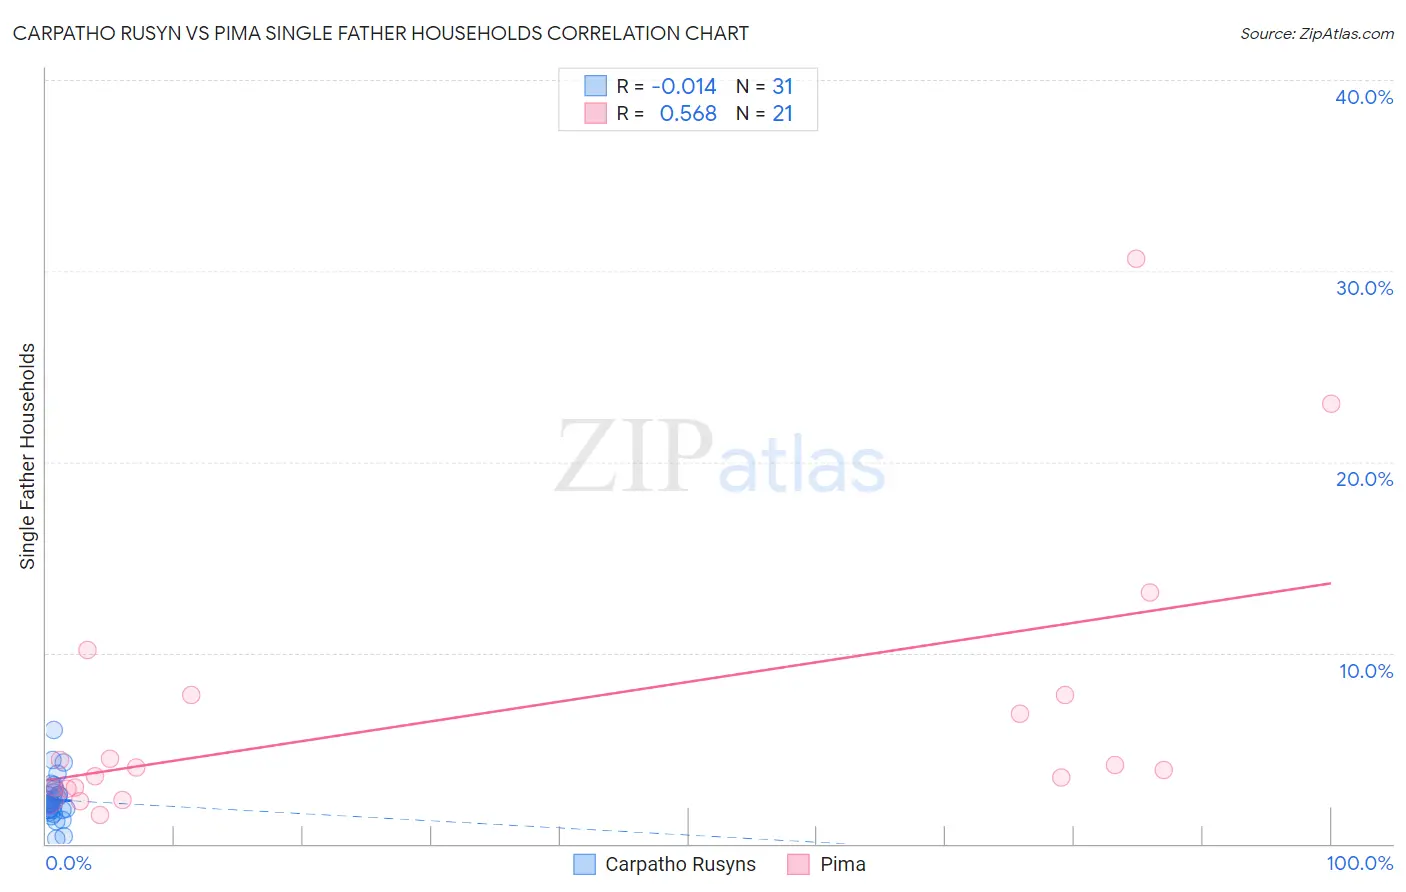
Carpatho Rusyn vs Pima Single Father Households Correlation Chart
The statistical analysis conducted on geographies consisting of 58,690,125 people shows no correlation between the proportion of Carpatho Rusyns and percentage of single father households in the United States with a correlation coefficient (R) of -0.014 and weighted average of 2.1%. Similarly, the statistical analysis conducted on geographies consisting of 61,336,251 people shows a substantial positive correlation between the proportion of Pima and percentage of single father households in the United States with a correlation coefficient (R) of 0.568 and weighted average of 4.2%, a difference of 99.1%.
Single Father Households Correlation Summary
| Measurement | Carpatho Rusyn | Pima |
| Minimum | 0.23% | 1.5% |
| Maximum | 6.0% | 30.6% |
| Range | 5.7% | 29.1% |
| Mean | 2.3% | 6.9% |
| Median | 2.1% | 4.0% |
| Interquartile 25% (IQ1) | 1.8% | 2.9% |
| Interquartile 75% (IQ3) | 2.7% | 7.8% |
| Interquartile Range (IQR) | 0.93% | 4.9% |
| Standard Deviation (Sample) | 1.1% | 7.3% |
| Standard Deviation (Population) | 1.1% | 7.2% |
Similar Demographics by Single Father Households
Demographics Similar to Carpatho Rusyns by Single Father Households
In terms of single father households, the demographic groups most similar to Carpatho Rusyns are Immigrants from Hungary (2.1%, a difference of 0.040%), Asian (2.1%, a difference of 0.12%), Greek (2.1%, a difference of 0.30%), New Zealander (2.1%, a difference of 0.31%), and Armenian (2.1%, a difference of 0.36%).
| Demographics | Rating | Rank | Single Father Households |
| Immigrants | Saudi Arabia | 99.8 /100 | #77 | Exceptional 2.1% |
| Estonians | 99.7 /100 | #78 | Exceptional 2.1% |
| Immigrants | Asia | 99.7 /100 | #79 | Exceptional 2.1% |
| Immigrants | South Africa | 99.7 /100 | #80 | Exceptional 2.1% |
| Armenians | 99.7 /100 | #81 | Exceptional 2.1% |
| New Zealanders | 99.7 /100 | #82 | Exceptional 2.1% |
| Greeks | 99.7 /100 | #83 | Exceptional 2.1% |
| Carpatho Rusyns | 99.6 /100 | #84 | Exceptional 2.1% |
| Immigrants | Hungary | 99.6 /100 | #85 | Exceptional 2.1% |
| Asians | 99.6 /100 | #86 | Exceptional 2.1% |
| Lithuanians | 99.5 /100 | #87 | Exceptional 2.1% |
| Bhutanese | 99.5 /100 | #88 | Exceptional 2.1% |
| Immigrants | Armenia | 99.5 /100 | #89 | Exceptional 2.1% |
| Immigrants | Pakistan | 99.5 /100 | #90 | Exceptional 2.1% |
| Immigrants | Guyana | 99.4 /100 | #91 | Exceptional 2.1% |
Demographics Similar to Pima by Single Father Households
In terms of single father households, the demographic groups most similar to Pima are Yakama (4.2%, a difference of 0.24%), Menominee (4.2%, a difference of 0.93%), Tohono O'odham (3.8%, a difference of 9.2%), Inupiat (4.9%, a difference of 16.4%), and Crow (3.5%, a difference of 18.8%).
| Demographics | Rating | Rank | Single Father Households |
| Natives/Alaskans | 0.0 /100 | #333 | Tragic 3.2% |
| Yuman | 0.0 /100 | #334 | Tragic 3.3% |
| Colville | 0.0 /100 | #335 | Tragic 3.3% |
| Paiute | 0.0 /100 | #336 | Tragic 3.3% |
| Pueblo | 0.0 /100 | #337 | Tragic 3.3% |
| Sioux | 0.0 /100 | #338 | Tragic 3.3% |
| Alaskan Athabascans | 0.0 /100 | #339 | Tragic 3.4% |
| Alaska Natives | 0.0 /100 | #340 | Tragic 3.5% |
| Crow | 0.0 /100 | #341 | Tragic 3.5% |
| Tohono O'odham | 0.0 /100 | #342 | Tragic 3.8% |
| Pima | 0.0 /100 | #343 | Tragic 4.2% |
| Yakama | 0.0 /100 | #344 | Tragic 4.2% |
| Menominee | 0.0 /100 | #345 | Tragic 4.2% |
| Inupiat | 0.0 /100 | #346 | Tragic 4.9% |
| Yup'ik | 0.0 /100 | #347 | Tragic 5.4% |