Immigrants from Chile vs Pima Single Father Households
COMPARE
Immigrants from Chile
Pima
Single Father Households
Single Father Households Comparison
Immigrants from Chile
Pima
2.2%
SINGLE FATHER HOUSEHOLDS
96.7/ 100
METRIC RATING
130th/ 347
METRIC RANK
4.2%
SINGLE FATHER HOUSEHOLDS
0.0/ 100
METRIC RATING
343rd/ 347
METRIC RANK
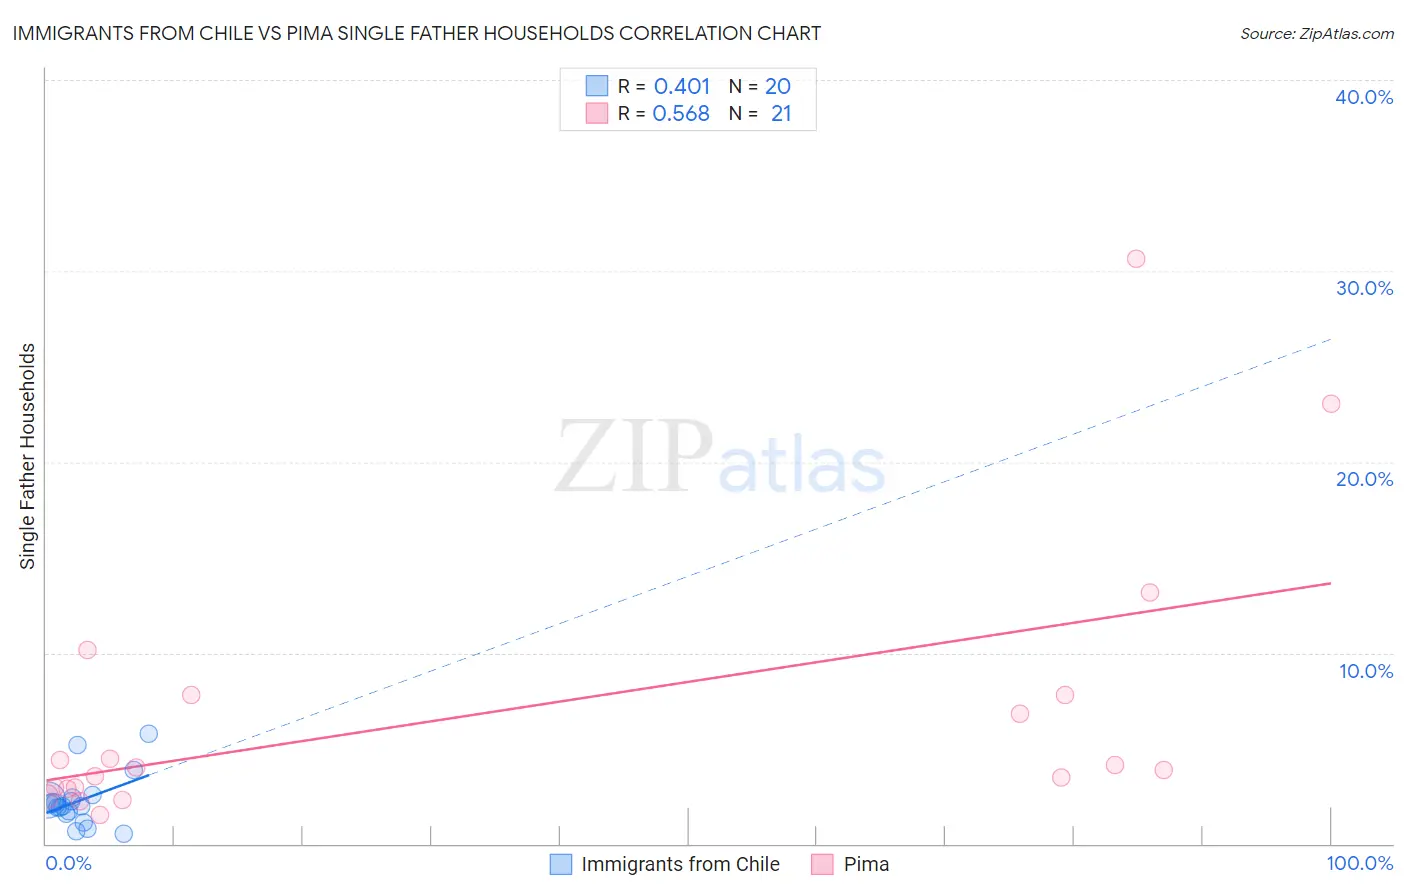
Immigrants from Chile vs Pima Single Father Households Correlation Chart
The statistical analysis conducted on geographies consisting of 217,839,905 people shows a moderate positive correlation between the proportion of Immigrants from Chile and percentage of single father households in the United States with a correlation coefficient (R) of 0.401 and weighted average of 2.2%. Similarly, the statistical analysis conducted on geographies consisting of 61,336,251 people shows a substantial positive correlation between the proportion of Pima and percentage of single father households in the United States with a correlation coefficient (R) of 0.568 and weighted average of 4.2%, a difference of 90.4%.
Single Father Households Correlation Summary
| Measurement | Immigrants from Chile | Pima |
| Minimum | 0.50% | 1.5% |
| Maximum | 5.8% | 30.6% |
| Range | 5.3% | 29.1% |
| Mean | 2.2% | 6.9% |
| Median | 2.0% | 4.0% |
| Interquartile 25% (IQ1) | 1.7% | 2.9% |
| Interquartile 75% (IQ3) | 2.3% | 7.8% |
| Interquartile Range (IQR) | 0.69% | 4.9% |
| Standard Deviation (Sample) | 1.3% | 7.3% |
| Standard Deviation (Population) | 1.3% | 7.2% |
Similar Demographics by Single Father Households
Demographics Similar to Immigrants from Chile by Single Father Households
In terms of single father households, the demographic groups most similar to Immigrants from Chile are Immigrants from Jordan (2.2%, a difference of 0.060%), Polish (2.2%, a difference of 0.070%), Serbian (2.2%, a difference of 0.11%), Immigrants from England (2.2%, a difference of 0.12%), and Moroccan (2.2%, a difference of 0.17%).
| Demographics | Rating | Rank | Single Father Households |
| Immigrants | Yemen | 97.5 /100 | #123 | Exceptional 2.2% |
| British West Indians | 97.4 /100 | #124 | Exceptional 2.2% |
| Immigrants | Indonesia | 97.4 /100 | #125 | Exceptional 2.2% |
| Moroccans | 96.9 /100 | #126 | Exceptional 2.2% |
| Jordanians | 96.9 /100 | #127 | Exceptional 2.2% |
| Immigrants | England | 96.8 /100 | #128 | Exceptional 2.2% |
| Serbians | 96.8 /100 | #129 | Exceptional 2.2% |
| Immigrants | Chile | 96.7 /100 | #130 | Exceptional 2.2% |
| Immigrants | Jordan | 96.6 /100 | #131 | Exceptional 2.2% |
| Poles | 96.5 /100 | #132 | Exceptional 2.2% |
| Taiwanese | 96.3 /100 | #133 | Exceptional 2.2% |
| Zimbabweans | 95.1 /100 | #134 | Exceptional 2.2% |
| Syrians | 94.8 /100 | #135 | Exceptional 2.2% |
| Chileans | 94.5 /100 | #136 | Exceptional 2.2% |
| Austrians | 94.2 /100 | #137 | Exceptional 2.2% |
Demographics Similar to Pima by Single Father Households
In terms of single father households, the demographic groups most similar to Pima are Yakama (4.2%, a difference of 0.24%), Menominee (4.2%, a difference of 0.93%), Tohono O'odham (3.8%, a difference of 9.2%), Inupiat (4.9%, a difference of 16.4%), and Crow (3.5%, a difference of 18.8%).
| Demographics | Rating | Rank | Single Father Households |
| Natives/Alaskans | 0.0 /100 | #333 | Tragic 3.2% |
| Yuman | 0.0 /100 | #334 | Tragic 3.3% |
| Colville | 0.0 /100 | #335 | Tragic 3.3% |
| Paiute | 0.0 /100 | #336 | Tragic 3.3% |
| Pueblo | 0.0 /100 | #337 | Tragic 3.3% |
| Sioux | 0.0 /100 | #338 | Tragic 3.3% |
| Alaskan Athabascans | 0.0 /100 | #339 | Tragic 3.4% |
| Alaska Natives | 0.0 /100 | #340 | Tragic 3.5% |
| Crow | 0.0 /100 | #341 | Tragic 3.5% |
| Tohono O'odham | 0.0 /100 | #342 | Tragic 3.8% |
| Pima | 0.0 /100 | #343 | Tragic 4.2% |
| Yakama | 0.0 /100 | #344 | Tragic 4.2% |
| Menominee | 0.0 /100 | #345 | Tragic 4.2% |
| Inupiat | 0.0 /100 | #346 | Tragic 4.9% |
| Yup'ik | 0.0 /100 | #347 | Tragic 5.4% |