Immigrants from Trinidad and Tobago vs Black/African American Single Father Households
COMPARE
Immigrants from Trinidad and Tobago
Black/African American
Single Father Households
Single Father Households Comparison
Immigrants from Trinidad and Tobago
Blacks/African Americans
2.2%
SINGLE FATHER HOUSEHOLDS
98.2/ 100
METRIC RATING
112th/ 347
METRIC RANK
2.4%
SINGLE FATHER HOUSEHOLDS
9.7/ 100
METRIC RATING
226th/ 347
METRIC RANK
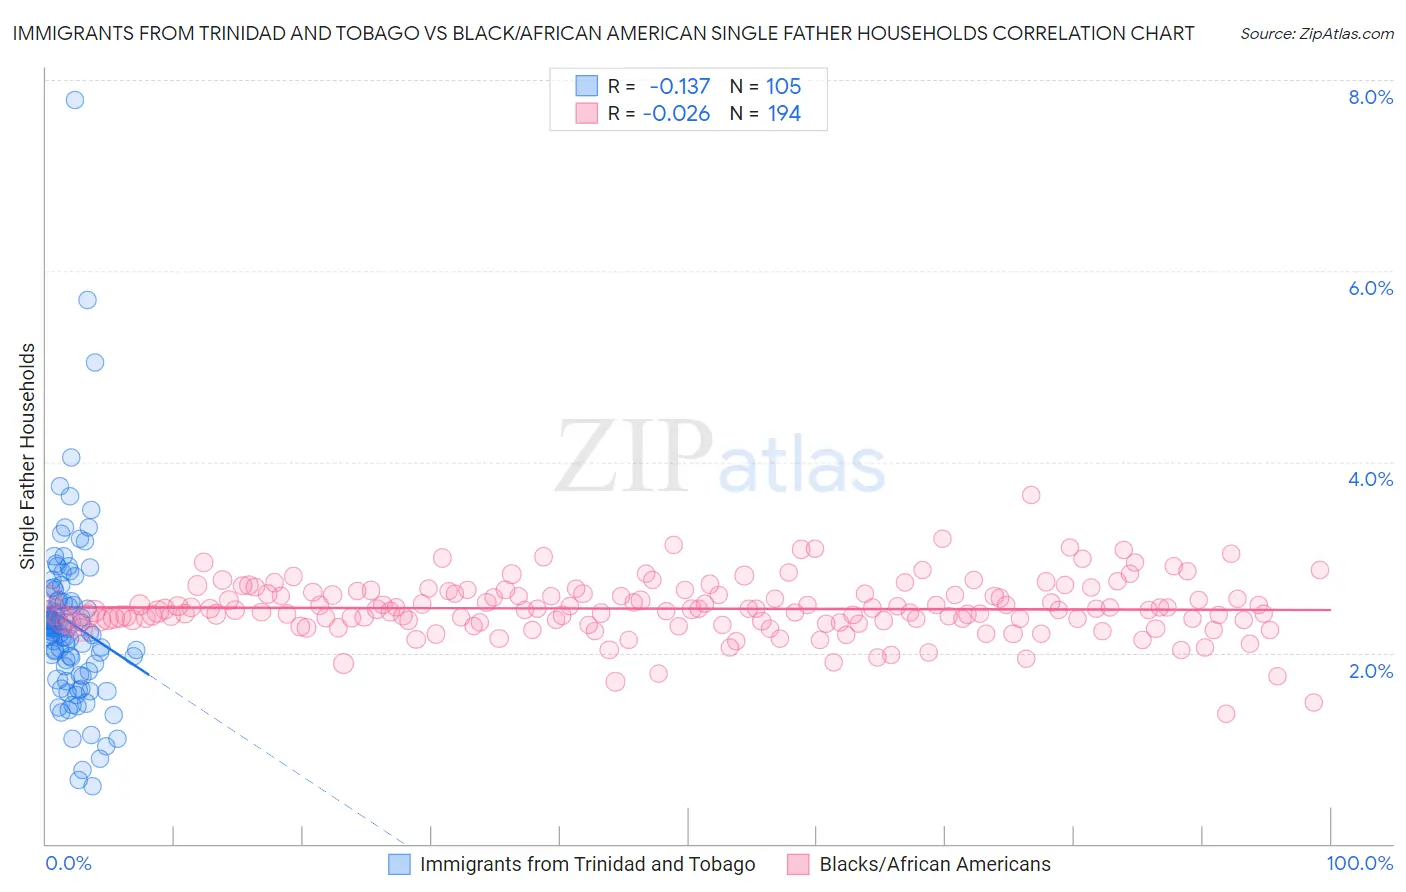
Immigrants from Trinidad and Tobago vs Black/African American Single Father Households Correlation Chart
The statistical analysis conducted on geographies consisting of 222,523,327 people shows a poor negative correlation between the proportion of Immigrants from Trinidad and Tobago and percentage of single father households in the United States with a correlation coefficient (R) of -0.137 and weighted average of 2.2%. Similarly, the statistical analysis conducted on geographies consisting of 552,512,239 people shows no correlation between the proportion of Blacks/African Americans and percentage of single father households in the United States with a correlation coefficient (R) of -0.026 and weighted average of 2.4%, a difference of 12.4%.
Single Father Households Correlation Summary
| Measurement | Immigrants from Trinidad and Tobago | Black/African American |
| Minimum | 0.61% | 1.4% |
| Maximum | 7.8% | 3.7% |
| Range | 7.2% | 2.3% |
| Mean | 2.3% | 2.5% |
| Median | 2.2% | 2.5% |
| Interquartile 25% (IQ1) | 1.8% | 2.3% |
| Interquartile 75% (IQ3) | 2.6% | 2.6% |
| Interquartile Range (IQR) | 0.82% | 0.30% |
| Standard Deviation (Sample) | 0.95% | 0.30% |
| Standard Deviation (Population) | 0.95% | 0.30% |
Similar Demographics by Single Father Households
Demographics Similar to Immigrants from Trinidad and Tobago by Single Father Households
In terms of single father households, the demographic groups most similar to Immigrants from Trinidad and Tobago are Iraqi (2.2%, a difference of 0.010%), Immigrants from Canada (2.2%, a difference of 0.040%), Immigrants from North America (2.2%, a difference of 0.060%), Immigrants from Barbados (2.2%, a difference of 0.090%), and Immigrants from Argentina (2.2%, a difference of 0.11%).
| Demographics | Rating | Rank | Single Father Households |
| Palestinians | 98.6 /100 | #105 | Exceptional 2.2% |
| Immigrants | Southern Europe | 98.6 /100 | #106 | Exceptional 2.2% |
| Slovenes | 98.5 /100 | #107 | Exceptional 2.2% |
| Immigrants | Netherlands | 98.5 /100 | #108 | Exceptional 2.2% |
| Barbadians | 98.4 /100 | #109 | Exceptional 2.2% |
| Italians | 98.3 /100 | #110 | Exceptional 2.2% |
| Immigrants | Canada | 98.3 /100 | #111 | Exceptional 2.2% |
| Immigrants | Trinidad and Tobago | 98.2 /100 | #112 | Exceptional 2.2% |
| Iraqis | 98.2 /100 | #113 | Exceptional 2.2% |
| Immigrants | North America | 98.2 /100 | #114 | Exceptional 2.2% |
| Immigrants | Barbados | 98.2 /100 | #115 | Exceptional 2.2% |
| Immigrants | Argentina | 98.1 /100 | #116 | Exceptional 2.2% |
| Hungarians | 97.9 /100 | #117 | Exceptional 2.2% |
| Immigrants | Morocco | 97.8 /100 | #118 | Exceptional 2.2% |
| Trinidadians and Tobagonians | 97.8 /100 | #119 | Exceptional 2.2% |
Demographics Similar to Blacks/African Americans by Single Father Households
In terms of single father households, the demographic groups most similar to Blacks/African Americans are Marshallese (2.4%, a difference of 0.010%), American (2.4%, a difference of 0.070%), Immigrants from Ghana (2.4%, a difference of 0.11%), Immigrants from Bahamas (2.4%, a difference of 0.19%), and Immigrants from Zaire (2.4%, a difference of 0.21%).
| Demographics | Rating | Rank | Single Father Households |
| Sudanese | 13.0 /100 | #219 | Poor 2.4% |
| Ghanaians | 12.9 /100 | #220 | Poor 2.4% |
| Immigrants | Burma/Myanmar | 12.1 /100 | #221 | Poor 2.4% |
| Immigrants | Eastern Africa | 11.9 /100 | #222 | Poor 2.4% |
| Immigrants | Uruguay | 11.0 /100 | #223 | Poor 2.4% |
| Immigrants | Bahamas | 10.6 /100 | #224 | Poor 2.4% |
| Marshallese | 9.7 /100 | #225 | Tragic 2.4% |
| Blacks/African Americans | 9.7 /100 | #226 | Tragic 2.4% |
| Americans | 9.3 /100 | #227 | Tragic 2.4% |
| Immigrants | Ghana | 9.1 /100 | #228 | Tragic 2.4% |
| Immigrants | Zaire | 8.6 /100 | #229 | Tragic 2.4% |
| Sub-Saharan Africans | 8.3 /100 | #230 | Tragic 2.4% |
| Immigrants | Nonimmigrants | 7.6 /100 | #231 | Tragic 2.4% |
| Pennsylvania Germans | 7.3 /100 | #232 | Tragic 2.4% |
| Immigrants | Western Africa | 7.0 /100 | #233 | Tragic 2.4% |