Nicaraguan vs Yakama Divorced or Separated
COMPARE
Nicaraguan
Yakama
Divorced or Separated
Divorced or Separated Comparison
Nicaraguans
Yakama
13.0%
DIVORCED OR SEPARATED
0.0/ 100
METRIC RATING
296th/ 347
METRIC RANK
12.3%
DIVORCED OR SEPARATED
7.8/ 100
METRIC RATING
230th/ 347
METRIC RANK
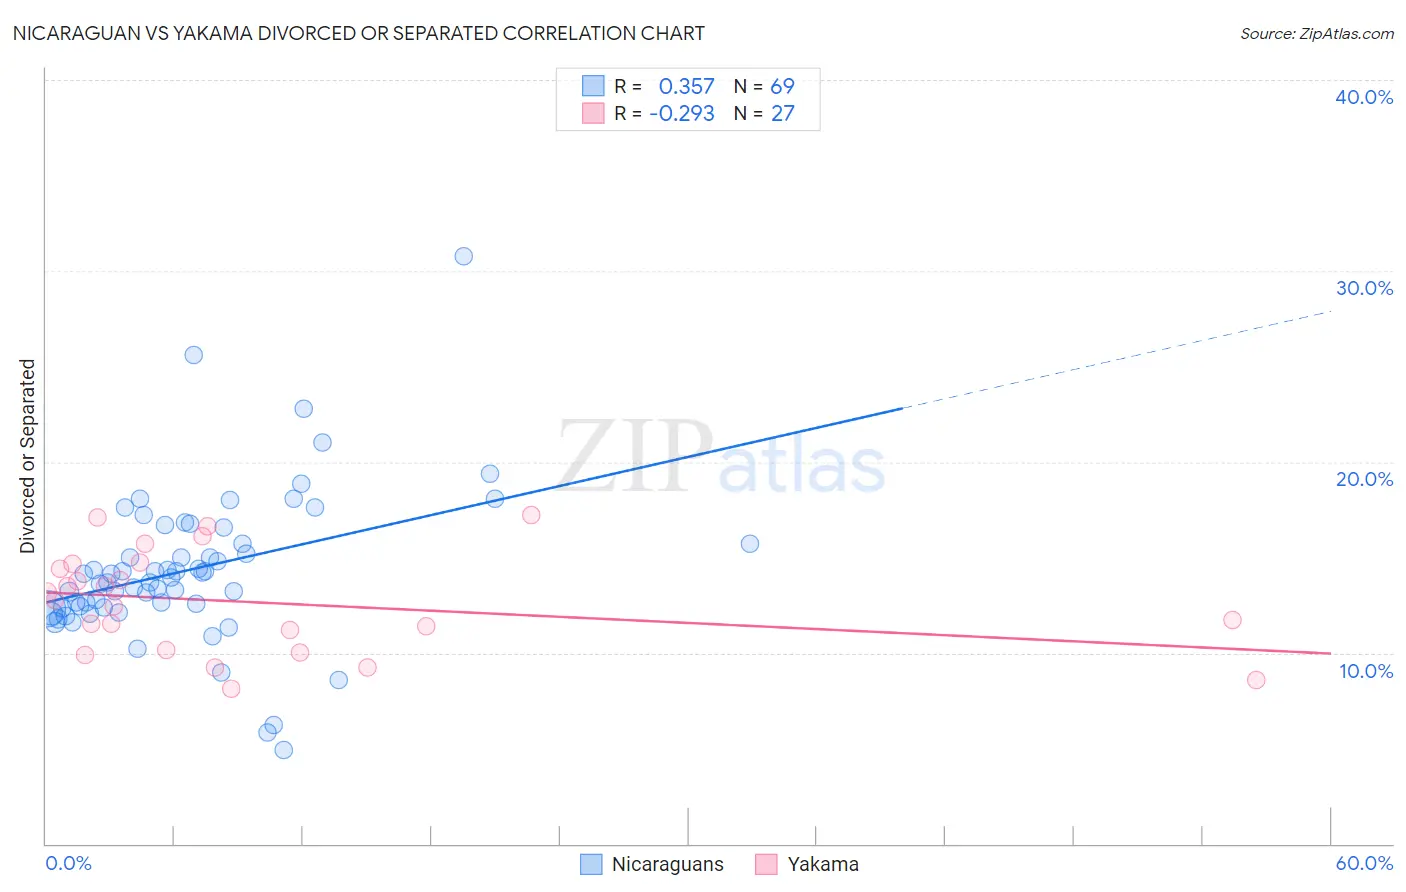
Nicaraguan vs Yakama Divorced or Separated Correlation Chart
The statistical analysis conducted on geographies consisting of 285,619,743 people shows a mild positive correlation between the proportion of Nicaraguans and percentage of population currently divorced or separated in the United States with a correlation coefficient (R) of 0.357 and weighted average of 13.0%. Similarly, the statistical analysis conducted on geographies consisting of 19,923,144 people shows a weak negative correlation between the proportion of Yakama and percentage of population currently divorced or separated in the United States with a correlation coefficient (R) of -0.293 and weighted average of 12.3%, a difference of 5.6%.
Divorced or Separated Correlation Summary
| Measurement | Nicaraguan | Yakama |
| Minimum | 4.9% | 8.1% |
| Maximum | 30.8% | 17.2% |
| Range | 25.9% | 9.1% |
| Mean | 14.3% | 12.7% |
| Median | 13.9% | 12.7% |
| Interquartile 25% (IQ1) | 12.4% | 10.1% |
| Interquartile 75% (IQ3) | 16.1% | 14.6% |
| Interquartile Range (IQR) | 3.8% | 4.5% |
| Standard Deviation (Sample) | 4.0% | 2.6% |
| Standard Deviation (Population) | 4.0% | 2.6% |
Similar Demographics by Divorced or Separated
Demographics Similar to Nicaraguans by Divorced or Separated
In terms of divorced or separated, the demographic groups most similar to Nicaraguans are Native/Alaskan (13.0%, a difference of 0.050%), Venezuelan (13.0%, a difference of 0.12%), Immigrants from Jamaica (13.0%, a difference of 0.16%), Celtic (13.0%, a difference of 0.41%), and Apache (12.9%, a difference of 0.54%).
| Demographics | Rating | Rank | Divorced or Separated |
| Iroquois | 0.0 /100 | #289 | Tragic 12.9% |
| Pima | 0.0 /100 | #290 | Tragic 12.9% |
| Immigrants | Honduras | 0.0 /100 | #291 | Tragic 12.9% |
| Scotch-Irish | 0.0 /100 | #292 | Tragic 12.9% |
| Jamaicans | 0.0 /100 | #293 | Tragic 12.9% |
| Apache | 0.0 /100 | #294 | Tragic 12.9% |
| Celtics | 0.0 /100 | #295 | Tragic 13.0% |
| Nicaraguans | 0.0 /100 | #296 | Tragic 13.0% |
| Natives/Alaskans | 0.0 /100 | #297 | Tragic 13.0% |
| Venezuelans | 0.0 /100 | #298 | Tragic 13.0% |
| Immigrants | Jamaica | 0.0 /100 | #299 | Tragic 13.0% |
| Immigrants | Cabo Verde | 0.0 /100 | #300 | Tragic 13.1% |
| Alaskan Athabascans | 0.0 /100 | #301 | Tragic 13.1% |
| Immigrants | Venezuela | 0.0 /100 | #302 | Tragic 13.1% |
| Cape Verdeans | 0.0 /100 | #303 | Tragic 13.1% |
Demographics Similar to Yakama by Divorced or Separated
In terms of divorced or separated, the demographic groups most similar to Yakama are Immigrants from Sudan (12.3%, a difference of 0.040%), Immigrants from Cameroon (12.3%, a difference of 0.060%), Hmong (12.3%, a difference of 0.11%), Yugoslavian (12.3%, a difference of 0.15%), and Immigrants from Western Africa (12.3%, a difference of 0.17%).
| Demographics | Rating | Rank | Divorced or Separated |
| Scandinavians | 10.4 /100 | #223 | Poor 12.3% |
| Immigrants | Azores | 9.7 /100 | #224 | Tragic 12.3% |
| Belgians | 9.7 /100 | #225 | Tragic 12.3% |
| Immigrants | Western Africa | 9.3 /100 | #226 | Tragic 12.3% |
| Hmong | 8.8 /100 | #227 | Tragic 12.3% |
| Immigrants | Cameroon | 8.3 /100 | #228 | Tragic 12.3% |
| Immigrants | Sudan | 8.2 /100 | #229 | Tragic 12.3% |
| Yakama | 7.8 /100 | #230 | Tragic 12.3% |
| Yugoslavians | 6.6 /100 | #231 | Tragic 12.3% |
| Canadians | 5.3 /100 | #232 | Tragic 12.4% |
| Malaysians | 4.8 /100 | #233 | Tragic 12.4% |
| West Indians | 4.4 /100 | #234 | Tragic 12.4% |
| Immigrants | Bosnia and Herzegovina | 4.3 /100 | #235 | Tragic 12.4% |
| Colombians | 4.2 /100 | #236 | Tragic 12.4% |
| Immigrants | Laos | 4.2 /100 | #237 | Tragic 12.4% |