Immigrants from Laos vs Yakama Divorced or Separated
COMPARE
Immigrants from Laos
Yakama
Divorced or Separated
Divorced or Separated Comparison
Immigrants from Laos
Yakama
12.4%
DIVORCED OR SEPARATED
4.2/ 100
METRIC RATING
237th/ 347
METRIC RANK
12.3%
DIVORCED OR SEPARATED
7.8/ 100
METRIC RATING
230th/ 347
METRIC RANK
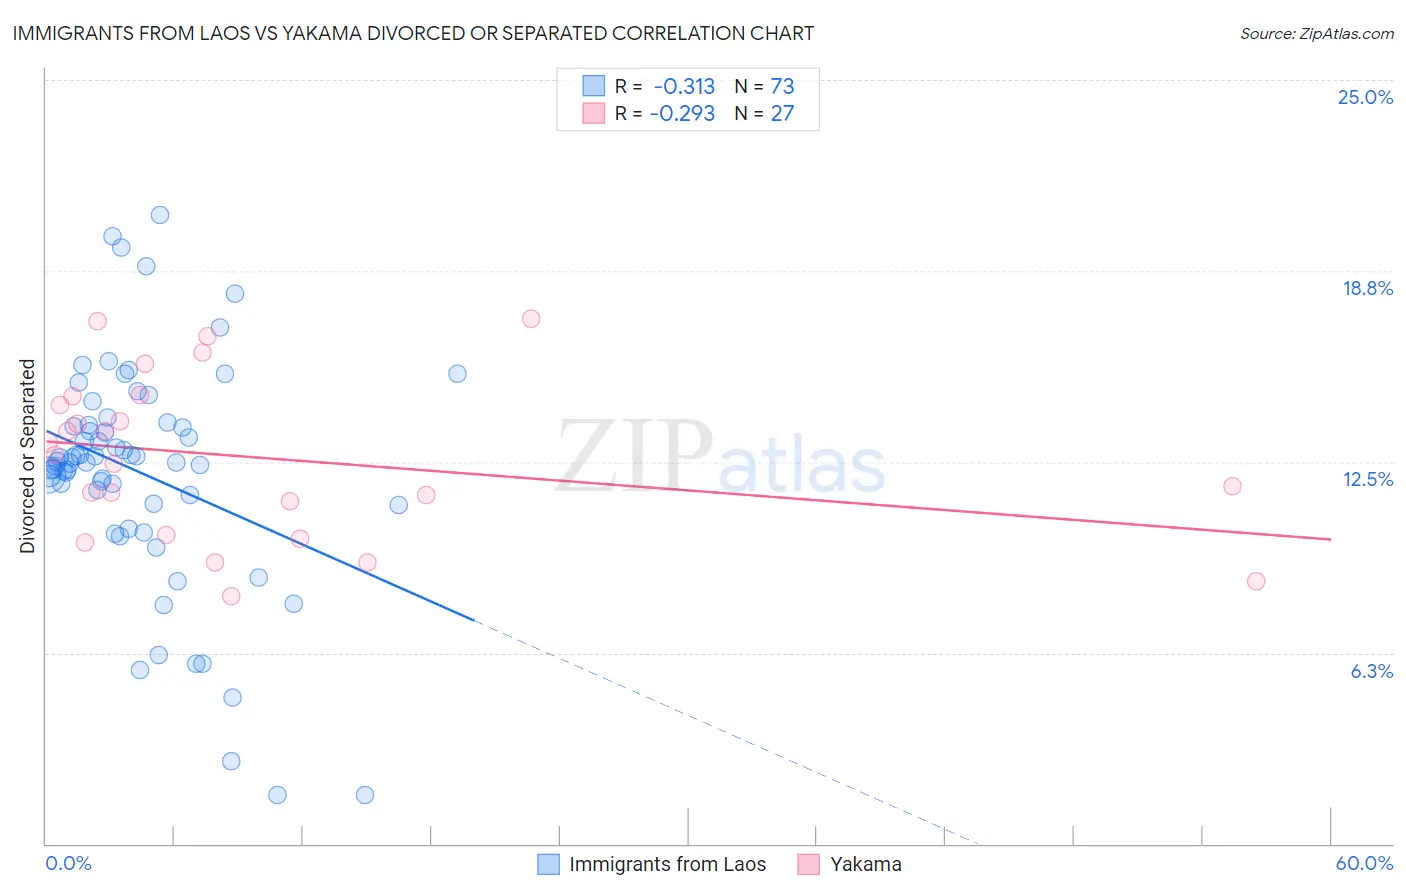
Immigrants from Laos vs Yakama Divorced or Separated Correlation Chart
The statistical analysis conducted on geographies consisting of 201,474,624 people shows a mild negative correlation between the proportion of Immigrants from Laos and percentage of population currently divorced or separated in the United States with a correlation coefficient (R) of -0.313 and weighted average of 12.4%. Similarly, the statistical analysis conducted on geographies consisting of 19,923,144 people shows a weak negative correlation between the proportion of Yakama and percentage of population currently divorced or separated in the United States with a correlation coefficient (R) of -0.293 and weighted average of 12.3%, a difference of 0.57%.
Divorced or Separated Correlation Summary
| Measurement | Immigrants from Laos | Yakama |
| Minimum | 1.6% | 8.1% |
| Maximum | 20.6% | 17.2% |
| Range | 19.0% | 9.1% |
| Mean | 12.1% | 12.7% |
| Median | 12.5% | 12.7% |
| Interquartile 25% (IQ1) | 11.1% | 10.1% |
| Interquartile 75% (IQ3) | 13.7% | 14.6% |
| Interquartile Range (IQR) | 2.6% | 4.5% |
| Standard Deviation (Sample) | 3.8% | 2.6% |
| Standard Deviation (Population) | 3.7% | 2.6% |
Demographics Similar to Immigrants from Laos and Yakama by Divorced or Separated
In terms of divorced or separated, the demographic groups most similar to Immigrants from Laos are Colombian (12.4%, a difference of 0.0%), Immigrants from Bosnia and Herzegovina (12.4%, a difference of 0.030%), Sudanese (12.4%, a difference of 0.030%), Immigrants from Germany (12.4%, a difference of 0.040%), and West Indian (12.4%, a difference of 0.050%). Similarly, the demographic groups most similar to Yakama are Immigrants from Sudan (12.3%, a difference of 0.040%), Immigrants from Cameroon (12.3%, a difference of 0.060%), Hmong (12.3%, a difference of 0.11%), Yugoslavian (12.3%, a difference of 0.15%), and Immigrants from Western Africa (12.3%, a difference of 0.17%).
| Demographics | Rating | Rank | Divorced or Separated |
| Scandinavians | 10.4 /100 | #223 | Poor 12.3% |
| Immigrants | Azores | 9.7 /100 | #224 | Tragic 12.3% |
| Belgians | 9.7 /100 | #225 | Tragic 12.3% |
| Immigrants | Western Africa | 9.3 /100 | #226 | Tragic 12.3% |
| Hmong | 8.8 /100 | #227 | Tragic 12.3% |
| Immigrants | Cameroon | 8.3 /100 | #228 | Tragic 12.3% |
| Immigrants | Sudan | 8.2 /100 | #229 | Tragic 12.3% |
| Yakama | 7.8 /100 | #230 | Tragic 12.3% |
| Yugoslavians | 6.6 /100 | #231 | Tragic 12.3% |
| Canadians | 5.3 /100 | #232 | Tragic 12.4% |
| Malaysians | 4.8 /100 | #233 | Tragic 12.4% |
| West Indians | 4.4 /100 | #234 | Tragic 12.4% |
| Immigrants | Bosnia and Herzegovina | 4.3 /100 | #235 | Tragic 12.4% |
| Colombians | 4.2 /100 | #236 | Tragic 12.4% |
| Immigrants | Laos | 4.2 /100 | #237 | Tragic 12.4% |
| Sudanese | 4.0 /100 | #238 | Tragic 12.4% |
| Immigrants | Germany | 4.0 /100 | #239 | Tragic 12.4% |
| British West Indians | 3.7 /100 | #240 | Tragic 12.4% |
| Uruguayans | 3.4 /100 | #241 | Tragic 12.4% |
| Dutch | 3.1 /100 | #242 | Tragic 12.4% |
| Immigrants | Latin America | 2.8 /100 | #243 | Tragic 12.4% |