Nicaraguan vs Yakama Unemployment Among Youth under 25 years
COMPARE
Nicaraguan
Yakama
Unemployment Among Youth under 25 years
Unemployment Among Youth under 25 years Comparison
Nicaraguans
Yakama
11.3%
UNEMPLOYMENT AMONG YOUTH UNDER 25 YEARS
94.3/ 100
METRIC RATING
97th/ 347
METRIC RANK
15.6%
UNEMPLOYMENT AMONG YOUTH UNDER 25 YEARS
0.0/ 100
METRIC RATING
330th/ 347
METRIC RANK
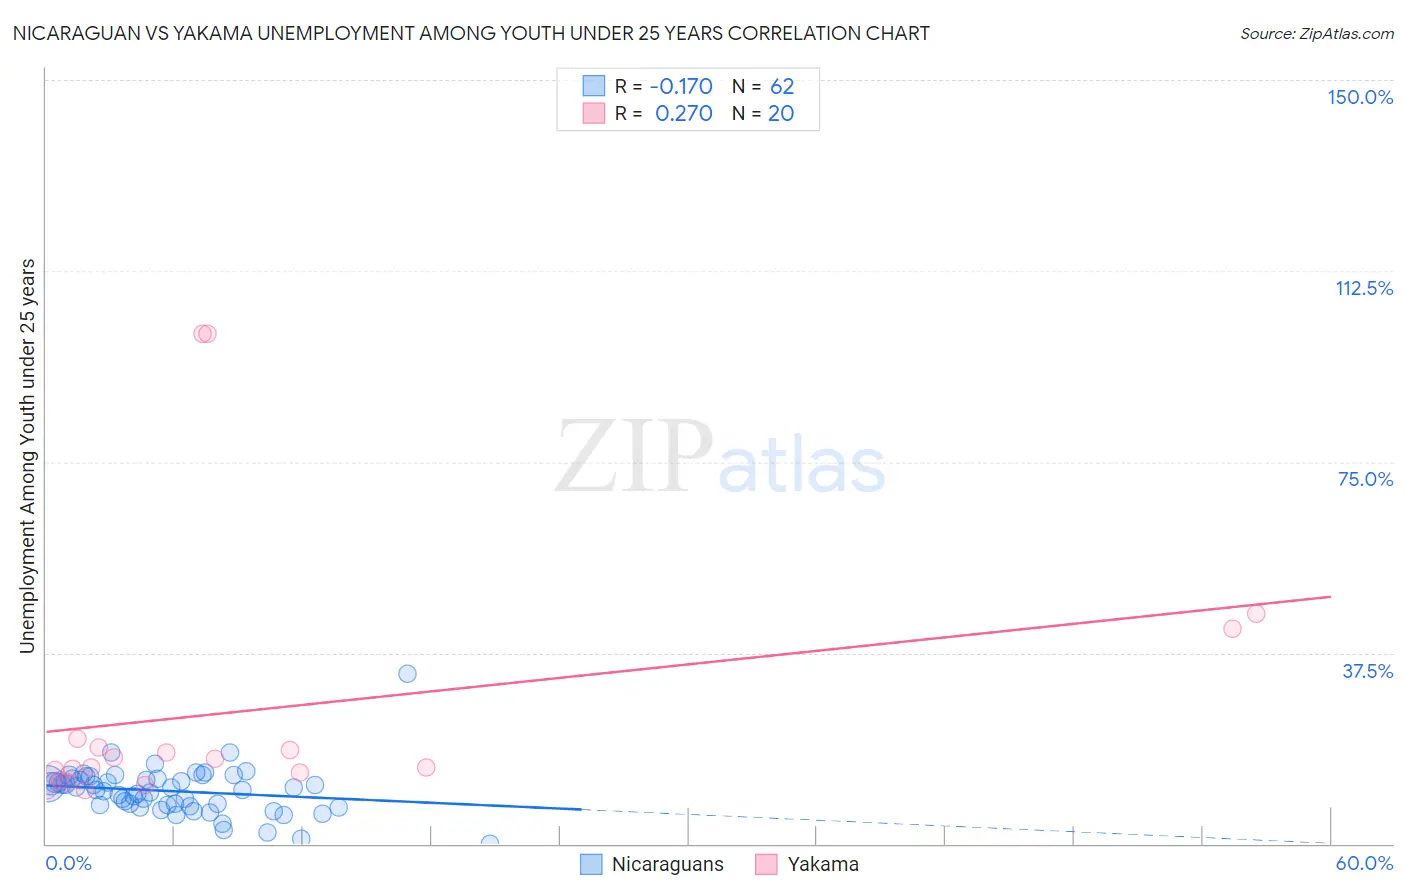
Nicaraguan vs Yakama Unemployment Among Youth under 25 years Correlation Chart
The statistical analysis conducted on geographies consisting of 284,206,393 people shows a poor negative correlation between the proportion of Nicaraguans and unemployment rate among youth under the age of 25 in the United States with a correlation coefficient (R) of -0.170 and weighted average of 11.3%. Similarly, the statistical analysis conducted on geographies consisting of 19,840,397 people shows a weak positive correlation between the proportion of Yakama and unemployment rate among youth under the age of 25 in the United States with a correlation coefficient (R) of 0.270 and weighted average of 15.6%, a difference of 38.3%.
Unemployment Among Youth under 25 years Correlation Summary
| Measurement | Nicaraguan | Yakama |
| Minimum | 0.10% | 10.6% |
| Maximum | 33.3% | 100.1% |
| Range | 33.2% | 89.5% |
| Mean | 10.3% | 26.4% |
| Median | 10.8% | 15.9% |
| Interquartile 25% (IQ1) | 7.6% | 13.3% |
| Interquartile 75% (IQ3) | 12.7% | 19.9% |
| Interquartile Range (IQR) | 5.1% | 6.6% |
| Standard Deviation (Sample) | 4.8% | 26.8% |
| Standard Deviation (Population) | 4.7% | 26.2% |
Similar Demographics by Unemployment Among Youth under 25 years
Demographics Similar to Nicaraguans by Unemployment Among Youth under 25 years
In terms of unemployment among youth under 25 years, the demographic groups most similar to Nicaraguans are Estonian (11.3%, a difference of 0.0%), Immigrants from Serbia (11.3%, a difference of 0.020%), Carpatho Rusyn (11.3%, a difference of 0.030%), Celtic (11.3%, a difference of 0.050%), and Pakistani (11.3%, a difference of 0.060%).
| Demographics | Rating | Rank | Unemployment Among Youth under 25 years |
| Immigrants | Bolivia | 95.5 /100 | #90 | Exceptional 11.2% |
| Immigrants | Taiwan | 95.1 /100 | #91 | Exceptional 11.2% |
| Immigrants | Latvia | 95.1 /100 | #92 | Exceptional 11.2% |
| Immigrants | North America | 95.1 /100 | #93 | Exceptional 11.2% |
| Lithuanians | 94.8 /100 | #94 | Exceptional 11.3% |
| Carpatho Rusyns | 94.4 /100 | #95 | Exceptional 11.3% |
| Immigrants | Serbia | 94.4 /100 | #96 | Exceptional 11.3% |
| Nicaraguans | 94.3 /100 | #97 | Exceptional 11.3% |
| Estonians | 94.2 /100 | #98 | Exceptional 11.3% |
| Celtics | 94.0 /100 | #99 | Exceptional 11.3% |
| Pakistanis | 94.0 /100 | #100 | Exceptional 11.3% |
| Iroquois | 93.8 /100 | #101 | Exceptional 11.3% |
| Immigrants | Thailand | 93.6 /100 | #102 | Exceptional 11.3% |
| Immigrants | Malaysia | 93.6 /100 | #103 | Exceptional 11.3% |
| Immigrants | Afghanistan | 93.4 /100 | #104 | Exceptional 11.3% |
Demographics Similar to Yakama by Unemployment Among Youth under 25 years
In terms of unemployment among youth under 25 years, the demographic groups most similar to Yakama are Immigrants from Yemen (15.6%, a difference of 0.040%), Immigrants from Dominican Republic (15.6%, a difference of 0.17%), British West Indian (15.5%, a difference of 0.28%), Dominican (15.7%, a difference of 0.83%), and Immigrants from Grenada (15.8%, a difference of 1.5%).
| Demographics | Rating | Rank | Unemployment Among Youth under 25 years |
| Immigrants | Trinidad and Tobago | 0.0 /100 | #323 | Tragic 14.6% |
| Immigrants | Jamaica | 0.0 /100 | #324 | Tragic 14.8% |
| Alaska Natives | 0.0 /100 | #325 | Tragic 14.9% |
| Immigrants | Barbados | 0.0 /100 | #326 | Tragic 15.2% |
| British West Indians | 0.0 /100 | #327 | Tragic 15.5% |
| Immigrants | Dominican Republic | 0.0 /100 | #328 | Tragic 15.6% |
| Immigrants | Yemen | 0.0 /100 | #329 | Tragic 15.6% |
| Yakama | 0.0 /100 | #330 | Tragic 15.6% |
| Dominicans | 0.0 /100 | #331 | Tragic 15.7% |
| Immigrants | Grenada | 0.0 /100 | #332 | Tragic 15.8% |
| Guyanese | 0.0 /100 | #333 | Tragic 15.9% |
| Immigrants | Guyana | 0.0 /100 | #334 | Tragic 15.9% |
| Immigrants | St. Vincent and the Grenadines | 0.0 /100 | #335 | Tragic 16.1% |
| Pima | 0.0 /100 | #336 | Tragic 16.2% |
| Arapaho | 0.0 /100 | #337 | Tragic 16.3% |