Nicaraguan vs Scottish Divorced or Separated
COMPARE
Nicaraguan
Scottish
Divorced or Separated
Divorced or Separated Comparison
Nicaraguans
Scottish
13.0%
DIVORCED OR SEPARATED
0.0/ 100
METRIC RATING
296th/ 347
METRIC RANK
12.6%
DIVORCED OR SEPARATED
0.4/ 100
METRIC RATING
267th/ 347
METRIC RANK
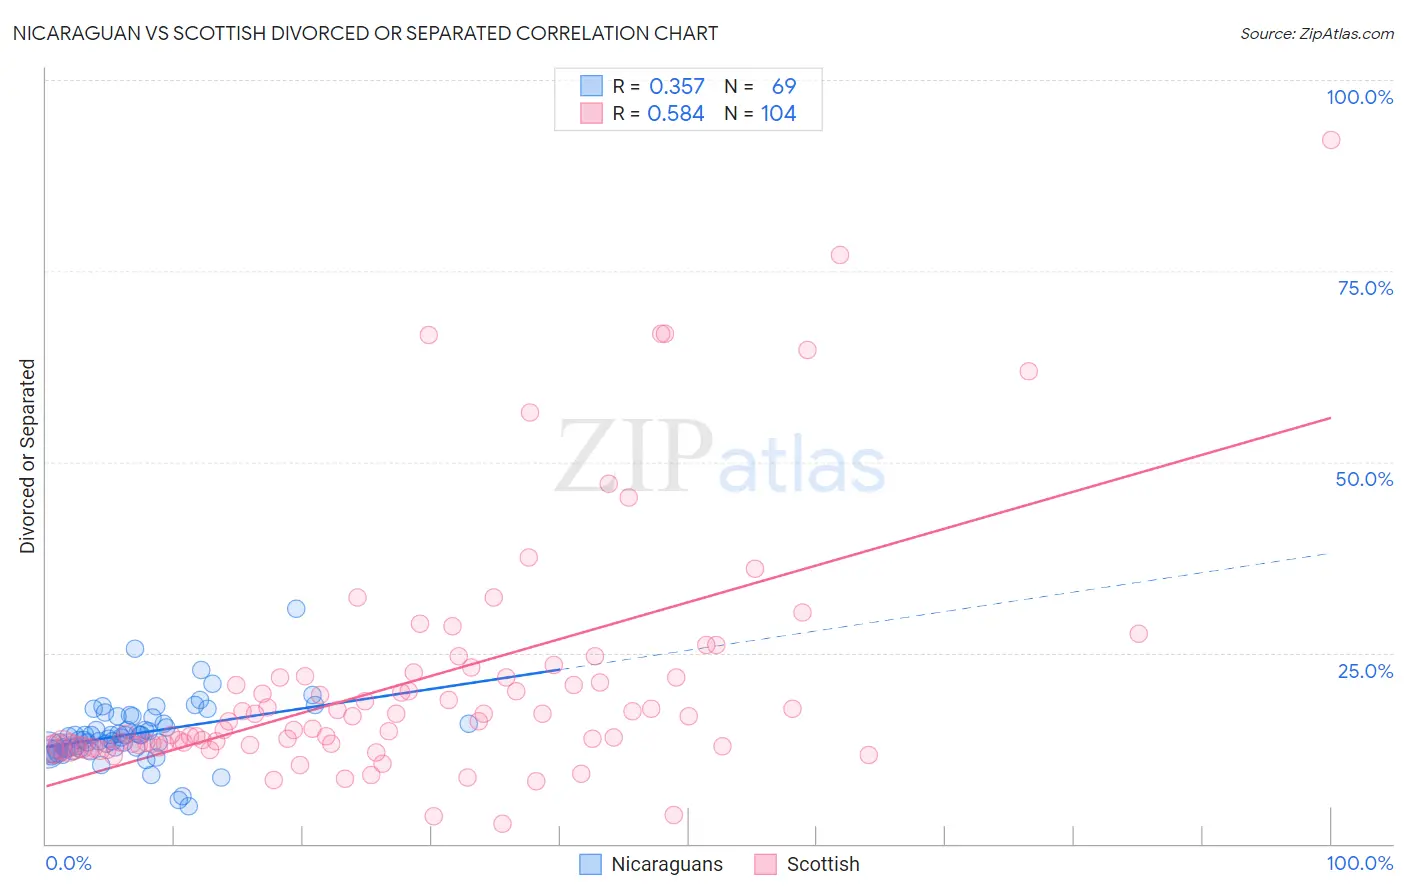
Nicaraguan vs Scottish Divorced or Separated Correlation Chart
The statistical analysis conducted on geographies consisting of 285,619,743 people shows a mild positive correlation between the proportion of Nicaraguans and percentage of population currently divorced or separated in the United States with a correlation coefficient (R) of 0.357 and weighted average of 13.0%. Similarly, the statistical analysis conducted on geographies consisting of 566,665,399 people shows a substantial positive correlation between the proportion of Scottish and percentage of population currently divorced or separated in the United States with a correlation coefficient (R) of 0.584 and weighted average of 12.6%, a difference of 3.0%.
Divorced or Separated Correlation Summary
| Measurement | Nicaraguan | Scottish |
| Minimum | 4.9% | 2.6% |
| Maximum | 30.8% | 92.2% |
| Range | 25.9% | 89.6% |
| Mean | 14.3% | 21.2% |
| Median | 13.9% | 16.0% |
| Interquartile 25% (IQ1) | 12.4% | 12.8% |
| Interquartile 75% (IQ3) | 16.1% | 21.8% |
| Interquartile Range (IQR) | 3.8% | 9.1% |
| Standard Deviation (Sample) | 4.0% | 16.0% |
| Standard Deviation (Population) | 4.0% | 15.9% |
Similar Demographics by Divorced or Separated
Demographics Similar to Nicaraguans by Divorced or Separated
In terms of divorced or separated, the demographic groups most similar to Nicaraguans are Native/Alaskan (13.0%, a difference of 0.050%), Venezuelan (13.0%, a difference of 0.12%), Immigrants from Jamaica (13.0%, a difference of 0.16%), Celtic (13.0%, a difference of 0.41%), and Apache (12.9%, a difference of 0.54%).
| Demographics | Rating | Rank | Divorced or Separated |
| Iroquois | 0.0 /100 | #289 | Tragic 12.9% |
| Pima | 0.0 /100 | #290 | Tragic 12.9% |
| Immigrants | Honduras | 0.0 /100 | #291 | Tragic 12.9% |
| Scotch-Irish | 0.0 /100 | #292 | Tragic 12.9% |
| Jamaicans | 0.0 /100 | #293 | Tragic 12.9% |
| Apache | 0.0 /100 | #294 | Tragic 12.9% |
| Celtics | 0.0 /100 | #295 | Tragic 13.0% |
| Nicaraguans | 0.0 /100 | #296 | Tragic 13.0% |
| Natives/Alaskans | 0.0 /100 | #297 | Tragic 13.0% |
| Venezuelans | 0.0 /100 | #298 | Tragic 13.0% |
| Immigrants | Jamaica | 0.0 /100 | #299 | Tragic 13.0% |
| Immigrants | Cabo Verde | 0.0 /100 | #300 | Tragic 13.1% |
| Alaskan Athabascans | 0.0 /100 | #301 | Tragic 13.1% |
| Immigrants | Venezuela | 0.0 /100 | #302 | Tragic 13.1% |
| Cape Verdeans | 0.0 /100 | #303 | Tragic 13.1% |
Demographics Similar to Scottish by Divorced or Separated
In terms of divorced or separated, the demographic groups most similar to Scottish are Fijian (12.6%, a difference of 0.010%), Immigrants from Liberia (12.6%, a difference of 0.030%), White/Caucasian (12.6%, a difference of 0.040%), Immigrants from Senegal (12.6%, a difference of 0.050%), and English (12.6%, a difference of 0.070%).
| Demographics | Rating | Rank | Divorced or Separated |
| Immigrants | Uruguay | 0.6 /100 | #260 | Tragic 12.6% |
| Immigrants | Dominica | 0.5 /100 | #261 | Tragic 12.6% |
| Basques | 0.5 /100 | #262 | Tragic 12.6% |
| Immigrants | Panama | 0.5 /100 | #263 | Tragic 12.6% |
| English | 0.5 /100 | #264 | Tragic 12.6% |
| Immigrants | Senegal | 0.5 /100 | #265 | Tragic 12.6% |
| Whites/Caucasians | 0.5 /100 | #266 | Tragic 12.6% |
| Scottish | 0.4 /100 | #267 | Tragic 12.6% |
| Fijians | 0.4 /100 | #268 | Tragic 12.6% |
| Immigrants | Liberia | 0.4 /100 | #269 | Tragic 12.6% |
| Ute | 0.4 /100 | #270 | Tragic 12.6% |
| Panamanians | 0.3 /100 | #271 | Tragic 12.7% |
| Immigrants | Middle Africa | 0.3 /100 | #272 | Tragic 12.7% |
| Immigrants | Micronesia | 0.3 /100 | #273 | Tragic 12.7% |
| Bermudans | 0.3 /100 | #274 | Tragic 12.7% |