Nicaraguan vs Immigrants from Morocco 5th Grade
COMPARE
Nicaraguan
Immigrants from Morocco
5th Grade
5th Grade Comparison
Nicaraguans
Immigrants from Morocco
95.9%
5TH GRADE
0.0/ 100
METRIC RATING
315th/ 347
METRIC RANK
97.1%
5TH GRADE
7.5/ 100
METRIC RATING
215th/ 347
METRIC RANK
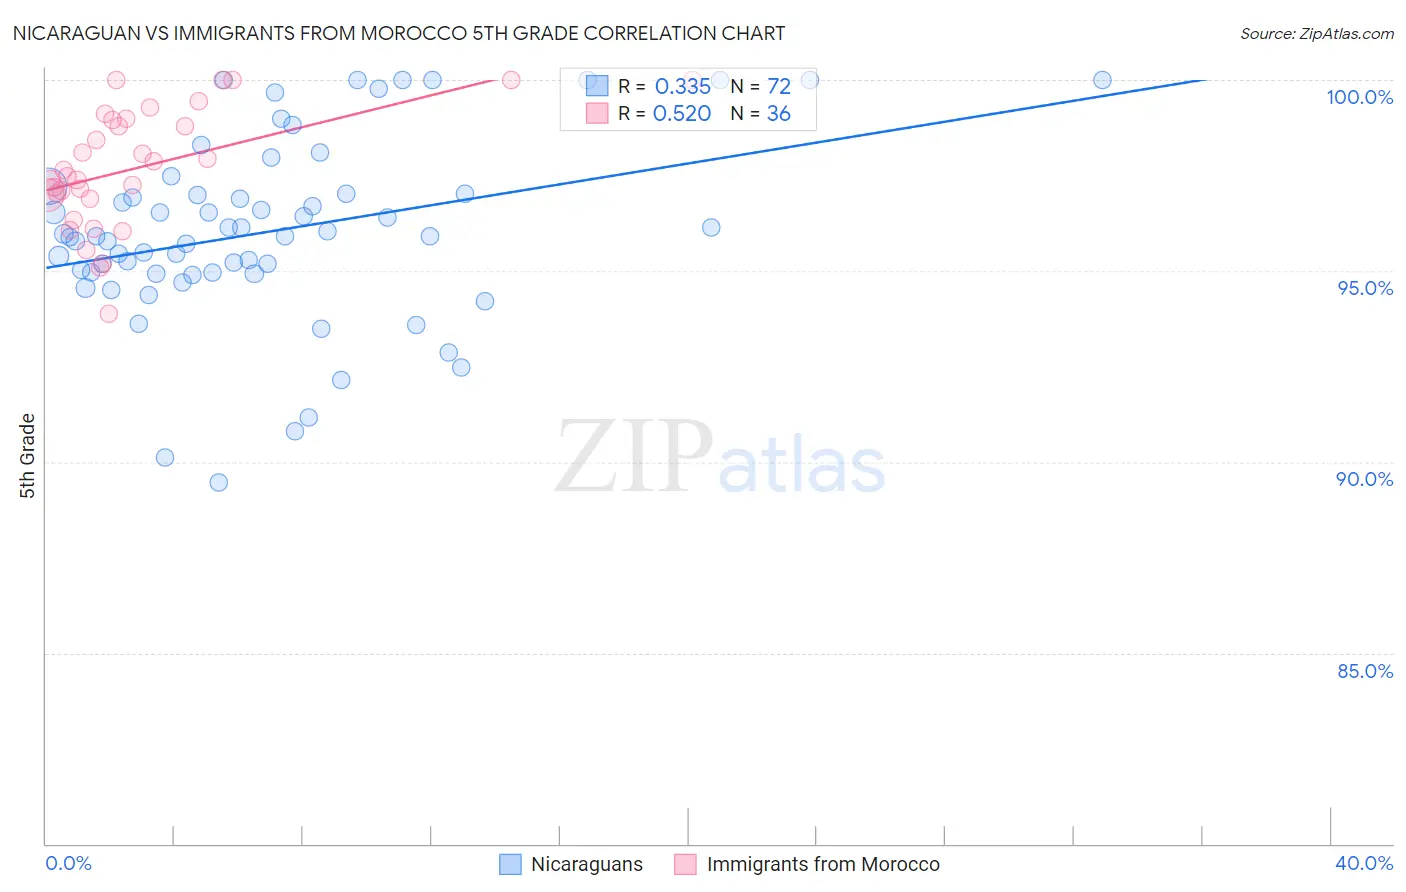
Nicaraguan vs Immigrants from Morocco 5th Grade Correlation Chart
The statistical analysis conducted on geographies consisting of 285,711,389 people shows a mild positive correlation between the proportion of Nicaraguans and percentage of population with at least 5th grade education in the United States with a correlation coefficient (R) of 0.335 and weighted average of 95.9%. Similarly, the statistical analysis conducted on geographies consisting of 178,910,634 people shows a substantial positive correlation between the proportion of Immigrants from Morocco and percentage of population with at least 5th grade education in the United States with a correlation coefficient (R) of 0.520 and weighted average of 97.1%, a difference of 1.2%.
5th Grade Correlation Summary
| Measurement | Nicaraguan | Immigrants from Morocco |
| Minimum | 89.5% | 93.9% |
| Maximum | 100.0% | 100.0% |
| Range | 10.5% | 6.1% |
| Mean | 96.0% | 97.7% |
| Median | 95.9% | 97.6% |
| Interquartile 25% (IQ1) | 94.9% | 96.9% |
| Interquartile 75% (IQ3) | 97.0% | 99.0% |
| Interquartile Range (IQR) | 2.1% | 2.0% |
| Standard Deviation (Sample) | 2.4% | 1.6% |
| Standard Deviation (Population) | 2.4% | 1.5% |
Similar Demographics by 5th Grade
Demographics Similar to Nicaraguans by 5th Grade
In terms of 5th grade, the demographic groups most similar to Nicaraguans are Bangladeshi (95.9%, a difference of 0.020%), Immigrants from Portugal (95.9%, a difference of 0.020%), Vietnamese (95.9%, a difference of 0.040%), Immigrants from Ecuador (95.8%, a difference of 0.060%), and Immigrants from Bangladesh (96.0%, a difference of 0.070%).
| Demographics | Rating | Rank | 5th Grade |
| Ecuadorians | 0.0 /100 | #308 | Tragic 96.0% |
| Immigrants | Guyana | 0.0 /100 | #309 | Tragic 96.0% |
| Indonesians | 0.0 /100 | #310 | Tragic 96.0% |
| Immigrants | Bangladesh | 0.0 /100 | #311 | Tragic 96.0% |
| Vietnamese | 0.0 /100 | #312 | Tragic 95.9% |
| Bangladeshis | 0.0 /100 | #313 | Tragic 95.9% |
| Immigrants | Portugal | 0.0 /100 | #314 | Tragic 95.9% |
| Nicaraguans | 0.0 /100 | #315 | Tragic 95.9% |
| Immigrants | Ecuador | 0.0 /100 | #316 | Tragic 95.8% |
| Belizeans | 0.0 /100 | #317 | Tragic 95.8% |
| Immigrants | Vietnam | 0.0 /100 | #318 | Tragic 95.8% |
| Japanese | 0.0 /100 | #319 | Tragic 95.7% |
| Central American Indians | 0.0 /100 | #320 | Tragic 95.7% |
| Immigrants | Belize | 0.0 /100 | #321 | Tragic 95.7% |
| Immigrants | Nicaragua | 0.0 /100 | #322 | Tragic 95.6% |
Demographics Similar to Immigrants from Morocco by 5th Grade
In terms of 5th grade, the demographic groups most similar to Immigrants from Morocco are Portuguese (97.1%, a difference of 0.0%), Costa Rican (97.1%, a difference of 0.0%), Samoan (97.1%, a difference of 0.010%), Immigrants from Iraq (97.1%, a difference of 0.010%), and Sudanese (97.1%, a difference of 0.010%).
| Demographics | Rating | Rank | 5th Grade |
| Laotians | 10.8 /100 | #208 | Poor 97.1% |
| Immigrants | Nepal | 10.3 /100 | #209 | Poor 97.1% |
| Immigrants | Oceania | 10.0 /100 | #210 | Poor 97.1% |
| Samoans | 8.5 /100 | #211 | Tragic 97.1% |
| Immigrants | Iraq | 8.3 /100 | #212 | Tragic 97.1% |
| Portuguese | 7.8 /100 | #213 | Tragic 97.1% |
| Costa Ricans | 7.7 /100 | #214 | Tragic 97.1% |
| Immigrants | Morocco | 7.5 /100 | #215 | Tragic 97.1% |
| Sudanese | 7.0 /100 | #216 | Tragic 97.1% |
| Immigrants | Lebanon | 6.8 /100 | #217 | Tragic 97.1% |
| Immigrants | Sudan | 6.5 /100 | #218 | Tragic 97.1% |
| Immigrants | Syria | 6.4 /100 | #219 | Tragic 97.1% |
| Immigrants | Southern Europe | 6.3 /100 | #220 | Tragic 97.1% |
| Sierra Leoneans | 6.0 /100 | #221 | Tragic 97.1% |
| Immigrants | Panama | 5.7 /100 | #222 | Tragic 97.0% |