Nicaraguan vs Ghanaian Family Households with Children
COMPARE
Nicaraguan
Ghanaian
Family Households with Children
Family Households with Children Comparison
Nicaraguans
Ghanaians
28.4%
FAMILY HOUSEHOLDS WITH CHILDREN
99.8/ 100
METRIC RATING
83rd/ 347
METRIC RANK
28.5%
FAMILY HOUSEHOLDS WITH CHILDREN
99.9/ 100
METRIC RATING
67th/ 347
METRIC RANK
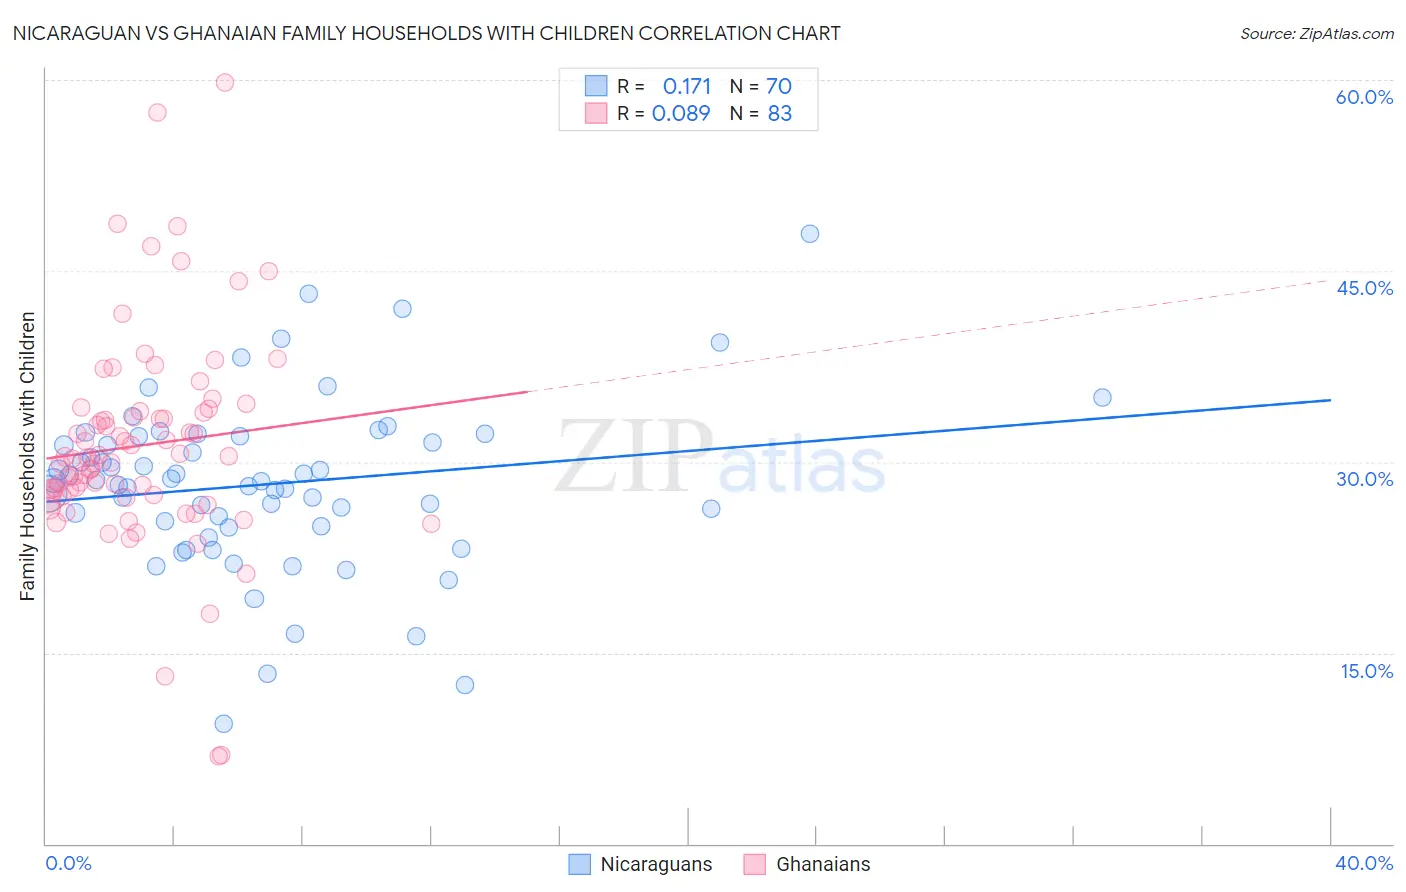
Nicaraguan vs Ghanaian Family Households with Children Correlation Chart
The statistical analysis conducted on geographies consisting of 285,584,121 people shows a poor positive correlation between the proportion of Nicaraguans and percentage of family households with children in the United States with a correlation coefficient (R) of 0.171 and weighted average of 28.4%. Similarly, the statistical analysis conducted on geographies consisting of 190,475,172 people shows a slight positive correlation between the proportion of Ghanaians and percentage of family households with children in the United States with a correlation coefficient (R) of 0.089 and weighted average of 28.5%, a difference of 0.54%.
Family Households with Children Correlation Summary
| Measurement | Nicaraguan | Ghanaian |
| Minimum | 9.4% | 6.8% |
| Maximum | 47.9% | 59.8% |
| Range | 38.5% | 53.0% |
| Mean | 28.2% | 31.3% |
| Median | 28.5% | 30.4% |
| Interquartile 25% (IQ1) | 25.0% | 27.3% |
| Interquartile 75% (IQ3) | 32.0% | 34.0% |
| Interquartile Range (IQR) | 7.0% | 6.7% |
| Standard Deviation (Sample) | 6.7% | 8.4% |
| Standard Deviation (Population) | 6.7% | 8.4% |
Demographics Similar to Nicaraguans and Ghanaians by Family Households with Children
In terms of family households with children, the demographic groups most similar to Nicaraguans are Costa Rican (28.4%, a difference of 0.0%), Immigrants from Syria (28.4%, a difference of 0.020%), Kenyan (28.4%, a difference of 0.050%), South American (28.4%, a difference of 0.090%), and Native/Alaskan (28.4%, a difference of 0.12%). Similarly, the demographic groups most similar to Ghanaians are Immigrants from Egypt (28.5%, a difference of 0.0%), Honduran (28.5%, a difference of 0.010%), Houma (28.5%, a difference of 0.020%), Immigrants from Korea (28.5%, a difference of 0.040%), and Immigrants from Honduras (28.5%, a difference of 0.090%).
| Demographics | Rating | Rank | Family Households with Children |
| Hondurans | 99.9 /100 | #65 | Exceptional 28.5% |
| Immigrants | Egypt | 99.9 /100 | #66 | Exceptional 28.5% |
| Ghanaians | 99.9 /100 | #67 | Exceptional 28.5% |
| Houma | 99.9 /100 | #68 | Exceptional 28.5% |
| Immigrants | Korea | 99.9 /100 | #69 | Exceptional 28.5% |
| Immigrants | Honduras | 99.9 /100 | #70 | Exceptional 28.5% |
| Burmese | 99.9 /100 | #71 | Exceptional 28.5% |
| Immigrants | Indonesia | 99.9 /100 | #72 | Exceptional 28.5% |
| Iraqis | 99.9 /100 | #73 | Exceptional 28.5% |
| Laotians | 99.9 /100 | #74 | Exceptional 28.5% |
| Immigrants | Jordan | 99.9 /100 | #75 | Exceptional 28.4% |
| Immigrants | Sri Lanka | 99.9 /100 | #76 | Exceptional 28.4% |
| Nigerians | 99.8 /100 | #77 | Exceptional 28.4% |
| Immigrants | Nepal | 99.8 /100 | #78 | Exceptional 28.4% |
| Immigrants | Iraq | 99.8 /100 | #79 | Exceptional 28.4% |
| Natives/Alaskans | 99.8 /100 | #80 | Exceptional 28.4% |
| South Americans | 99.8 /100 | #81 | Exceptional 28.4% |
| Kenyans | 99.8 /100 | #82 | Exceptional 28.4% |
| Nicaraguans | 99.8 /100 | #83 | Exceptional 28.4% |
| Costa Ricans | 99.8 /100 | #84 | Exceptional 28.4% |
| Immigrants | Syria | 99.8 /100 | #85 | Exceptional 28.4% |