Nicaraguan vs Immigrants from North America Family Households with Children
COMPARE
Nicaraguan
Immigrants from North America
Family Households with Children
Family Households with Children Comparison
Nicaraguans
Immigrants from North America
28.4%
FAMILY HOUSEHOLDS WITH CHILDREN
99.8/ 100
METRIC RATING
83rd/ 347
METRIC RANK
26.6%
FAMILY HOUSEHOLDS WITH CHILDREN
0.3/ 100
METRIC RATING
283rd/ 347
METRIC RANK
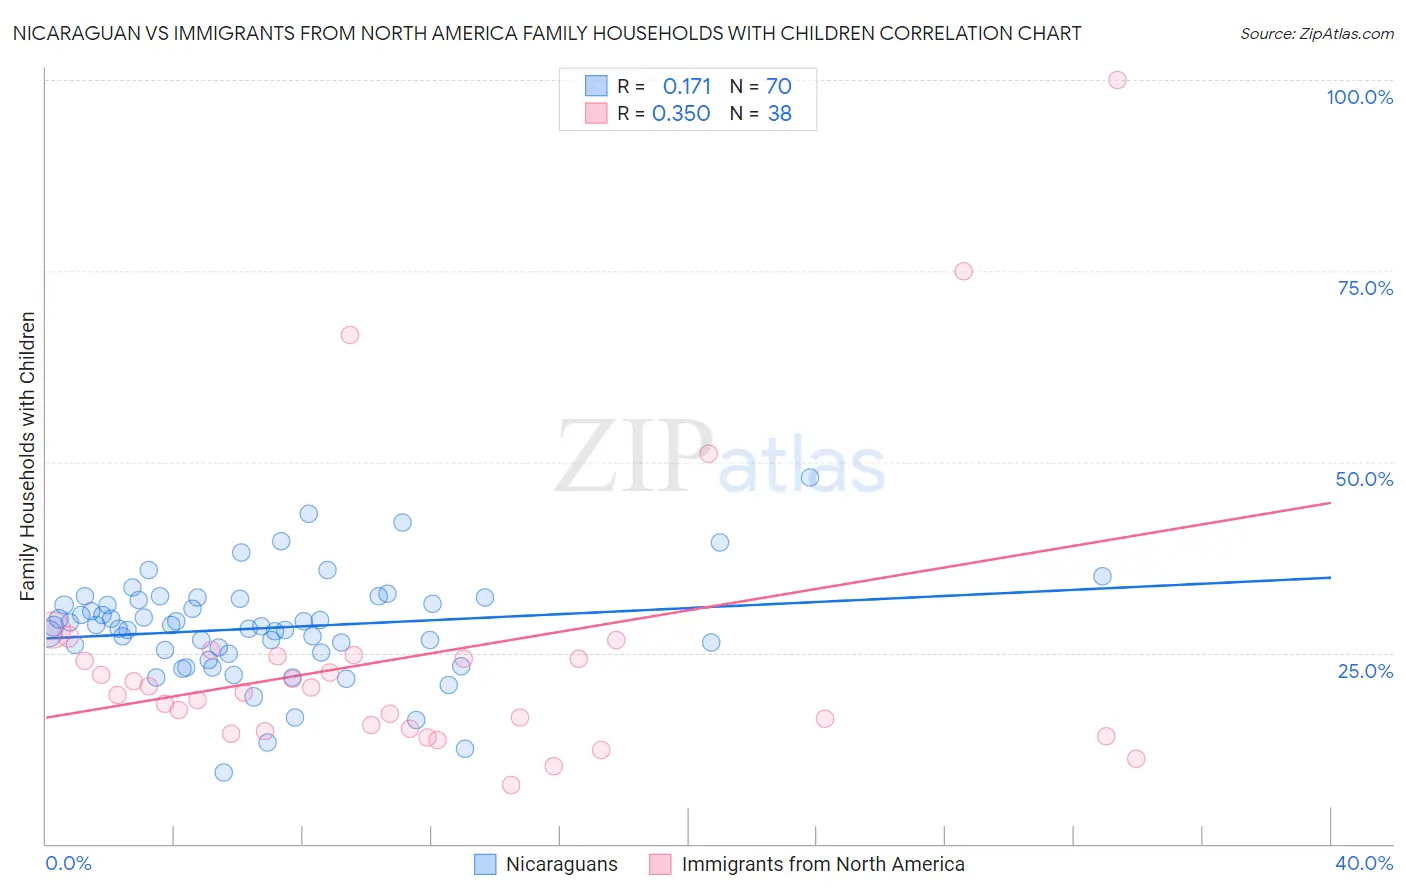
Nicaraguan vs Immigrants from North America Family Households with Children Correlation Chart
The statistical analysis conducted on geographies consisting of 285,584,121 people shows a poor positive correlation between the proportion of Nicaraguans and percentage of family households with children in the United States with a correlation coefficient (R) of 0.171 and weighted average of 28.4%. Similarly, the statistical analysis conducted on geographies consisting of 461,965,747 people shows a mild positive correlation between the proportion of Immigrants from North America and percentage of family households with children in the United States with a correlation coefficient (R) of 0.350 and weighted average of 26.6%, a difference of 6.9%.
Family Households with Children Correlation Summary
| Measurement | Nicaraguan | Immigrants from North America |
| Minimum | 9.4% | 7.6% |
| Maximum | 47.9% | 100.0% |
| Range | 38.5% | 92.4% |
| Mean | 28.2% | 24.6% |
| Median | 28.5% | 20.1% |
| Interquartile 25% (IQ1) | 25.0% | 15.0% |
| Interquartile 75% (IQ3) | 32.0% | 24.6% |
| Interquartile Range (IQR) | 7.0% | 9.6% |
| Standard Deviation (Sample) | 6.7% | 18.5% |
| Standard Deviation (Population) | 6.7% | 18.3% |
Similar Demographics by Family Households with Children
Demographics Similar to Nicaraguans by Family Households with Children
In terms of family households with children, the demographic groups most similar to Nicaraguans are Costa Rican (28.4%, a difference of 0.0%), Immigrants from Syria (28.4%, a difference of 0.020%), Kenyan (28.4%, a difference of 0.050%), South American (28.4%, a difference of 0.090%), and Native/Alaskan (28.4%, a difference of 0.12%).
| Demographics | Rating | Rank | Family Households with Children |
| Immigrants | Sri Lanka | 99.9 /100 | #76 | Exceptional 28.4% |
| Nigerians | 99.8 /100 | #77 | Exceptional 28.4% |
| Immigrants | Nepal | 99.8 /100 | #78 | Exceptional 28.4% |
| Immigrants | Iraq | 99.8 /100 | #79 | Exceptional 28.4% |
| Natives/Alaskans | 99.8 /100 | #80 | Exceptional 28.4% |
| South Americans | 99.8 /100 | #81 | Exceptional 28.4% |
| Kenyans | 99.8 /100 | #82 | Exceptional 28.4% |
| Nicaraguans | 99.8 /100 | #83 | Exceptional 28.4% |
| Costa Ricans | 99.8 /100 | #84 | Exceptional 28.4% |
| Immigrants | Syria | 99.8 /100 | #85 | Exceptional 28.4% |
| Immigrants | Western Africa | 99.6 /100 | #86 | Exceptional 28.3% |
| Colombians | 99.6 /100 | #87 | Exceptional 28.3% |
| Liberians | 99.6 /100 | #88 | Exceptional 28.3% |
| Immigrants | Costa Rica | 99.6 /100 | #89 | Exceptional 28.3% |
| Immigrants | Thailand | 99.5 /100 | #90 | Exceptional 28.2% |
Demographics Similar to Immigrants from North America by Family Households with Children
In terms of family households with children, the demographic groups most similar to Immigrants from North America are Immigrants from Canada (26.5%, a difference of 0.020%), Cambodian (26.5%, a difference of 0.050%), French American Indian (26.6%, a difference of 0.070%), Lithuanian (26.6%, a difference of 0.080%), and Immigrants from Senegal (26.5%, a difference of 0.10%).
| Demographics | Rating | Rank | Family Households with Children |
| Immigrants | Spain | 0.5 /100 | #276 | Tragic 26.6% |
| Celtics | 0.4 /100 | #277 | Tragic 26.6% |
| Immigrants | Europe | 0.4 /100 | #278 | Tragic 26.6% |
| Finns | 0.4 /100 | #279 | Tragic 26.6% |
| Senegalese | 0.4 /100 | #280 | Tragic 26.6% |
| Lithuanians | 0.3 /100 | #281 | Tragic 26.6% |
| French American Indians | 0.3 /100 | #282 | Tragic 26.6% |
| Immigrants | North America | 0.3 /100 | #283 | Tragic 26.6% |
| Immigrants | Canada | 0.3 /100 | #284 | Tragic 26.5% |
| Cambodians | 0.2 /100 | #285 | Tragic 26.5% |
| Immigrants | Senegal | 0.2 /100 | #286 | Tragic 26.5% |
| Shoshone | 0.2 /100 | #287 | Tragic 26.5% |
| Russians | 0.2 /100 | #288 | Tragic 26.5% |
| Immigrants | Sweden | 0.2 /100 | #289 | Tragic 26.5% |
| Albanians | 0.2 /100 | #290 | Tragic 26.5% |