Navajo vs Immigrants from Northern Europe Currently Married
COMPARE
Navajo
Immigrants from Northern Europe
Currently Married
Currently Married Comparison
Navajo
Immigrants from Northern Europe
39.0%
CURRENTLY MARRIED
0.0/ 100
METRIC RATING
341st/ 347
METRIC RANK
48.8%
CURRENTLY MARRIED
99.4/ 100
METRIC RATING
35th/ 347
METRIC RANK
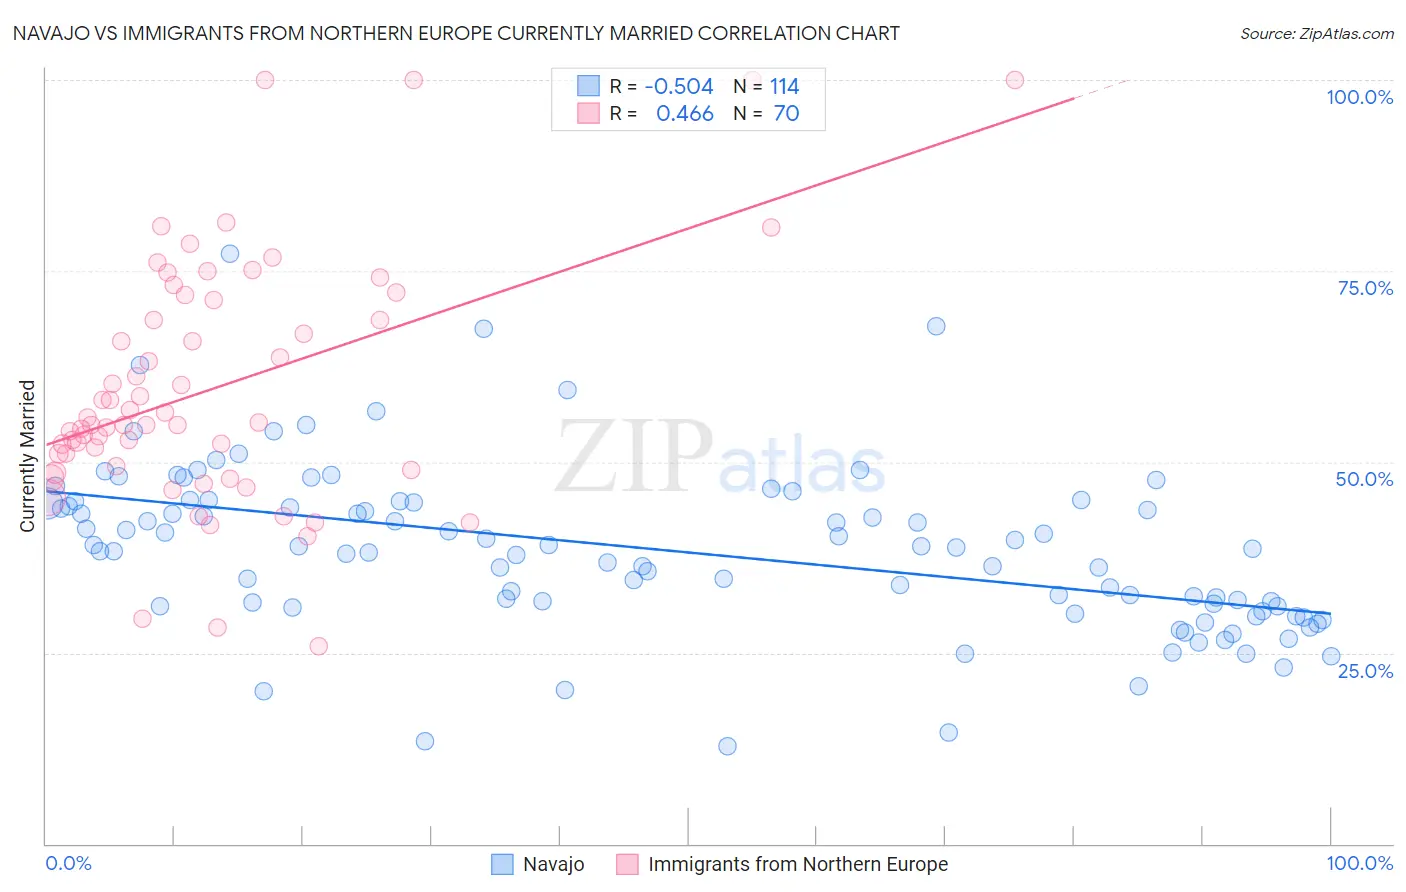
Navajo vs Immigrants from Northern Europe Currently Married Correlation Chart
The statistical analysis conducted on geographies consisting of 224,862,150 people shows a substantial negative correlation between the proportion of Navajo and percentage of population currently married in the United States with a correlation coefficient (R) of -0.504 and weighted average of 39.0%. Similarly, the statistical analysis conducted on geographies consisting of 477,179,061 people shows a moderate positive correlation between the proportion of Immigrants from Northern Europe and percentage of population currently married in the United States with a correlation coefficient (R) of 0.466 and weighted average of 48.8%, a difference of 25.2%.
Currently Married Correlation Summary
| Measurement | Navajo | Immigrants from Northern Europe |
| Minimum | 12.8% | 25.8% |
| Maximum | 77.3% | 100.0% |
| Range | 64.5% | 74.2% |
| Mean | 38.4% | 59.6% |
| Median | 38.7% | 55.0% |
| Interquartile 25% (IQ1) | 31.1% | 49.4% |
| Interquartile 75% (IQ3) | 44.6% | 71.2% |
| Interquartile Range (IQR) | 13.5% | 21.8% |
| Standard Deviation (Sample) | 10.9% | 16.0% |
| Standard Deviation (Population) | 10.8% | 15.9% |
Similar Demographics by Currently Married
Demographics Similar to Navajo by Currently Married
In terms of currently married, the demographic groups most similar to Navajo are Immigrants from Dominican Republic (38.9%, a difference of 0.17%), Immigrants from Grenada (39.1%, a difference of 0.35%), Dominican (39.5%, a difference of 1.3%), Cape Verdean (39.6%, a difference of 1.5%), and Black/African American (39.6%, a difference of 1.6%).
| Demographics | Rating | Rank | Currently Married |
| Yup'ik | 0.0 /100 | #333 | Tragic 39.9% |
| Puerto Ricans | 0.0 /100 | #334 | Tragic 39.9% |
| Lumbee | 0.0 /100 | #335 | Tragic 39.8% |
| British West Indians | 0.0 /100 | #336 | Tragic 39.8% |
| Blacks/African Americans | 0.0 /100 | #337 | Tragic 39.6% |
| Cape Verdeans | 0.0 /100 | #338 | Tragic 39.6% |
| Dominicans | 0.0 /100 | #339 | Tragic 39.5% |
| Immigrants | Grenada | 0.0 /100 | #340 | Tragic 39.1% |
| Navajo | 0.0 /100 | #341 | Tragic 39.0% |
| Immigrants | Dominican Republic | 0.0 /100 | #342 | Tragic 38.9% |
| Pueblo | 0.0 /100 | #343 | Tragic 38.2% |
| Immigrants | Cabo Verde | 0.0 /100 | #344 | Tragic 37.8% |
| Tohono O'odham | 0.0 /100 | #345 | Tragic 36.8% |
| Hopi | 0.0 /100 | #346 | Tragic 36.5% |
| Pima | 0.0 /100 | #347 | Tragic 35.9% |
Demographics Similar to Immigrants from Northern Europe by Currently Married
In terms of currently married, the demographic groups most similar to Immigrants from Northern Europe are Italian (48.8%, a difference of 0.010%), Hungarian (48.8%, a difference of 0.010%), Immigrants from Lithuania (48.8%, a difference of 0.020%), Czechoslovakian (48.8%, a difference of 0.050%), and Irish (48.9%, a difference of 0.080%).
| Demographics | Rating | Rank | Currently Married |
| Welsh | 99.5 /100 | #28 | Exceptional 48.9% |
| Croatians | 99.5 /100 | #29 | Exceptional 48.9% |
| Eastern Europeans | 99.5 /100 | #30 | Exceptional 48.9% |
| Poles | 99.5 /100 | #31 | Exceptional 48.9% |
| Immigrants | Hong Kong | 99.5 /100 | #32 | Exceptional 48.9% |
| Irish | 99.5 /100 | #33 | Exceptional 48.9% |
| Immigrants | Lithuania | 99.4 /100 | #34 | Exceptional 48.8% |
| Immigrants | Northern Europe | 99.4 /100 | #35 | Exceptional 48.8% |
| Italians | 99.4 /100 | #36 | Exceptional 48.8% |
| Hungarians | 99.4 /100 | #37 | Exceptional 48.8% |
| Czechoslovakians | 99.4 /100 | #38 | Exceptional 48.8% |
| British | 99.4 /100 | #39 | Exceptional 48.8% |
| Immigrants | Canada | 99.4 /100 | #40 | Exceptional 48.8% |
| Greeks | 99.3 /100 | #41 | Exceptional 48.8% |
| Finns | 99.3 /100 | #42 | Exceptional 48.8% |