Navajo vs Immigrants from Kazakhstan Unemployment Among Ages 30 to 34 years
COMPARE
Navajo
Immigrants from Kazakhstan
Unemployment Among Ages 30 to 34 years
Unemployment Among Ages 30 to 34 years Comparison
Navajo
Immigrants from Kazakhstan
10.6%
UNEMPLOYMENT AMONG AGES 30 TO 34 YEARS
0.0/ 100
METRIC RATING
341st/ 347
METRIC RANK
5.5%
UNEMPLOYMENT AMONG AGES 30 TO 34 YEARS
33.9/ 100
METRIC RATING
190th/ 347
METRIC RANK
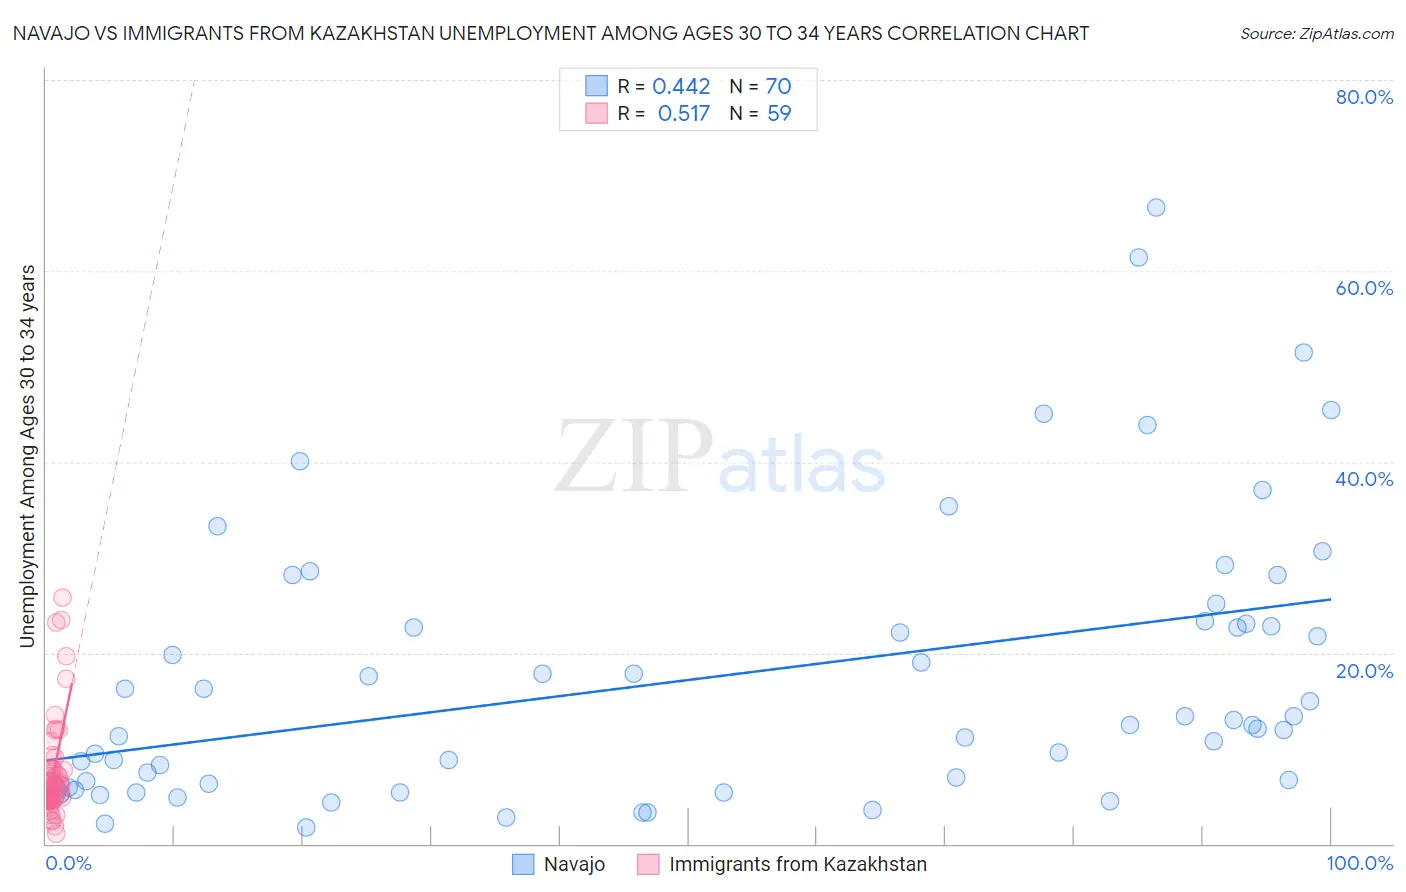
Navajo vs Immigrants from Kazakhstan Unemployment Among Ages 30 to 34 years Correlation Chart
The statistical analysis conducted on geographies consisting of 217,031,350 people shows a moderate positive correlation between the proportion of Navajo and unemployment rate among population between the ages 30 and 34 in the United States with a correlation coefficient (R) of 0.442 and weighted average of 10.6%. Similarly, the statistical analysis conducted on geographies consisting of 122,179,815 people shows a substantial positive correlation between the proportion of Immigrants from Kazakhstan and unemployment rate among population between the ages 30 and 34 in the United States with a correlation coefficient (R) of 0.517 and weighted average of 5.5%, a difference of 91.0%.
Unemployment Among Ages 30 to 34 years Correlation Summary
| Measurement | Navajo | Immigrants from Kazakhstan |
| Minimum | 1.7% | 1.0% |
| Maximum | 66.7% | 25.8% |
| Range | 65.0% | 24.8% |
| Mean | 17.4% | 7.4% |
| Median | 12.5% | 5.8% |
| Interquartile 25% (IQ1) | 5.9% | 4.7% |
| Interquartile 75% (IQ3) | 23.1% | 7.7% |
| Interquartile Range (IQR) | 17.2% | 3.0% |
| Standard Deviation (Sample) | 14.5% | 5.2% |
| Standard Deviation (Population) | 14.4% | 5.1% |
Similar Demographics by Unemployment Among Ages 30 to 34 years
Demographics Similar to Navajo by Unemployment Among Ages 30 to 34 years
In terms of unemployment among ages 30 to 34 years, the demographic groups most similar to Navajo are Yuman (10.6%, a difference of 0.40%), Crow (10.3%, a difference of 2.0%), Inupiat (10.8%, a difference of 2.5%), Tohono O'odham (9.8%, a difference of 7.3%), and Yakama (9.8%, a difference of 8.1%).
| Demographics | Rating | Rank | Unemployment Among Ages 30 to 34 years |
| Pueblo | 0.0 /100 | #333 | Tragic 8.3% |
| Alaska Natives | 0.0 /100 | #334 | Tragic 8.5% |
| Puerto Ricans | 0.0 /100 | #335 | Tragic 8.9% |
| Colville | 0.0 /100 | #336 | Tragic 9.0% |
| Pima | 0.0 /100 | #337 | Tragic 9.6% |
| Yakama | 0.0 /100 | #338 | Tragic 9.8% |
| Tohono O'odham | 0.0 /100 | #339 | Tragic 9.8% |
| Crow | 0.0 /100 | #340 | Tragic 10.3% |
| Navajo | 0.0 /100 | #341 | Tragic 10.6% |
| Yuman | 0.0 /100 | #342 | Tragic 10.6% |
| Inupiat | 0.0 /100 | #343 | Tragic 10.8% |
| Hopi | 0.0 /100 | #344 | Tragic 11.9% |
| Arapaho | 0.0 /100 | #345 | Tragic 12.8% |
| Tsimshian | 0.0 /100 | #346 | Tragic 13.8% |
| Yup'ik | 0.0 /100 | #347 | Tragic 18.5% |
Demographics Similar to Immigrants from Kazakhstan by Unemployment Among Ages 30 to 34 years
In terms of unemployment among ages 30 to 34 years, the demographic groups most similar to Immigrants from Kazakhstan are Immigrants from England (5.5%, a difference of 0.14%), Immigrants from Norway (5.5%, a difference of 0.16%), Irish (5.5%, a difference of 0.20%), Moroccan (5.5%, a difference of 0.21%), and Immigrants from Africa (5.5%, a difference of 0.22%).
| Demographics | Rating | Rank | Unemployment Among Ages 30 to 34 years |
| Hungarians | 43.1 /100 | #183 | Average 5.5% |
| Malaysians | 41.8 /100 | #184 | Average 5.5% |
| Immigrants | Western Europe | 39.1 /100 | #185 | Fair 5.5% |
| Canadians | 38.2 /100 | #186 | Fair 5.5% |
| Immigrants | Western Asia | 38.2 /100 | #187 | Fair 5.5% |
| Immigrants | Norway | 36.1 /100 | #188 | Fair 5.5% |
| Immigrants | England | 35.7 /100 | #189 | Fair 5.5% |
| Immigrants | Kazakhstan | 33.9 /100 | #190 | Fair 5.5% |
| Irish | 31.3 /100 | #191 | Fair 5.5% |
| Moroccans | 31.2 /100 | #192 | Fair 5.5% |
| Immigrants | Africa | 31.0 /100 | #193 | Fair 5.5% |
| Slavs | 30.9 /100 | #194 | Fair 5.5% |
| Finns | 30.7 /100 | #195 | Fair 5.5% |
| Immigrants | South America | 29.8 /100 | #196 | Fair 5.5% |
| Immigrants | Nicaragua | 28.9 /100 | #197 | Fair 5.5% |