Native Hawaiian vs Greek Single Father Households
COMPARE
Native Hawaiian
Greek
Single Father Households
Single Father Households Comparison
Native Hawaiians
Greeks
2.5%
SINGLE FATHER HOUSEHOLDS
2.5/ 100
METRIC RATING
246th/ 347
METRIC RANK
2.1%
SINGLE FATHER HOUSEHOLDS
99.7/ 100
METRIC RATING
83rd/ 347
METRIC RANK
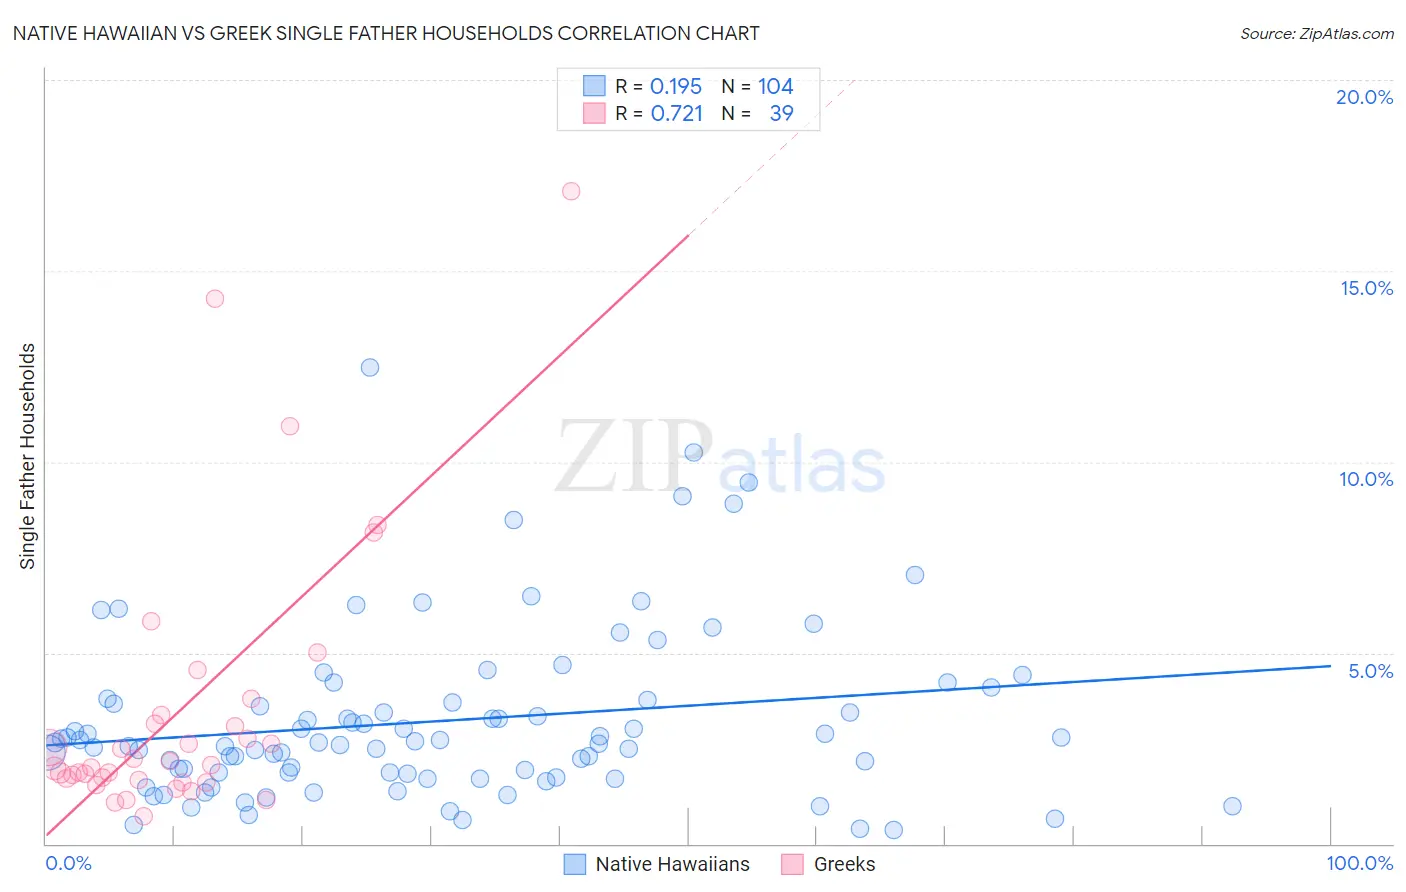
Native Hawaiian vs Greek Single Father Households Correlation Chart
The statistical analysis conducted on geographies consisting of 329,768,096 people shows a poor positive correlation between the proportion of Native Hawaiians and percentage of single father households in the United States with a correlation coefficient (R) of 0.195 and weighted average of 2.5%. Similarly, the statistical analysis conducted on geographies consisting of 475,873,790 people shows a strong positive correlation between the proportion of Greeks and percentage of single father households in the United States with a correlation coefficient (R) of 0.721 and weighted average of 2.1%, a difference of 19.3%.
Single Father Households Correlation Summary
| Measurement | Native Hawaiian | Greek |
| Minimum | 0.37% | 0.73% |
| Maximum | 12.5% | 17.1% |
| Range | 12.1% | 16.3% |
| Mean | 3.2% | 3.5% |
| Median | 2.6% | 2.1% |
| Interquartile 25% (IQ1) | 1.8% | 1.7% |
| Interquartile 75% (IQ3) | 3.7% | 3.4% |
| Interquartile Range (IQR) | 1.9% | 1.7% |
| Standard Deviation (Sample) | 2.2% | 3.6% |
| Standard Deviation (Population) | 2.2% | 3.6% |
Similar Demographics by Single Father Households
Demographics Similar to Native Hawaiians by Single Father Households
In terms of single father households, the demographic groups most similar to Native Hawaiians are Basque (2.5%, a difference of 0.020%), Delaware (2.5%, a difference of 0.020%), Bahamian (2.5%, a difference of 0.060%), Immigrants from Cameroon (2.5%, a difference of 0.14%), and Immigrants from Middle Africa (2.5%, a difference of 0.23%).
| Demographics | Rating | Rank | Single Father Households |
| Immigrants | Oceania | 5.8 /100 | #239 | Tragic 2.5% |
| Immigrants | Dominica | 4.8 /100 | #240 | Tragic 2.5% |
| Portuguese | 4.1 /100 | #241 | Tragic 2.5% |
| Osage | 4.1 /100 | #242 | Tragic 2.5% |
| Spaniards | 3.1 /100 | #243 | Tragic 2.5% |
| Immigrants | Middle Africa | 2.8 /100 | #244 | Tragic 2.5% |
| Basques | 2.5 /100 | #245 | Tragic 2.5% |
| Native Hawaiians | 2.5 /100 | #246 | Tragic 2.5% |
| Delaware | 2.5 /100 | #247 | Tragic 2.5% |
| Bahamians | 2.4 /100 | #248 | Tragic 2.5% |
| Immigrants | Cameroon | 2.3 /100 | #249 | Tragic 2.5% |
| Somalis | 2.1 /100 | #250 | Tragic 2.5% |
| Liberians | 2.0 /100 | #251 | Tragic 2.5% |
| Immigrants | Eritrea | 2.0 /100 | #252 | Tragic 2.5% |
| Immigrants | Somalia | 1.9 /100 | #253 | Tragic 2.5% |
Demographics Similar to Greeks by Single Father Households
In terms of single father households, the demographic groups most similar to Greeks are New Zealander (2.1%, a difference of 0.010%), Armenian (2.1%, a difference of 0.060%), Immigrants from South Africa (2.1%, a difference of 0.14%), Immigrants from Asia (2.1%, a difference of 0.23%), and Carpatho Rusyn (2.1%, a difference of 0.30%).
| Demographics | Rating | Rank | Single Father Households |
| Immigrants | Scotland | 99.8 /100 | #76 | Exceptional 2.1% |
| Immigrants | Saudi Arabia | 99.8 /100 | #77 | Exceptional 2.1% |
| Estonians | 99.7 /100 | #78 | Exceptional 2.1% |
| Immigrants | Asia | 99.7 /100 | #79 | Exceptional 2.1% |
| Immigrants | South Africa | 99.7 /100 | #80 | Exceptional 2.1% |
| Armenians | 99.7 /100 | #81 | Exceptional 2.1% |
| New Zealanders | 99.7 /100 | #82 | Exceptional 2.1% |
| Greeks | 99.7 /100 | #83 | Exceptional 2.1% |
| Carpatho Rusyns | 99.6 /100 | #84 | Exceptional 2.1% |
| Immigrants | Hungary | 99.6 /100 | #85 | Exceptional 2.1% |
| Asians | 99.6 /100 | #86 | Exceptional 2.1% |
| Lithuanians | 99.5 /100 | #87 | Exceptional 2.1% |
| Bhutanese | 99.5 /100 | #88 | Exceptional 2.1% |
| Immigrants | Armenia | 99.5 /100 | #89 | Exceptional 2.1% |
| Immigrants | Pakistan | 99.5 /100 | #90 | Exceptional 2.1% |